MIST
Magnetosphere, Ionosphere and Solar-Terrestrial
Equatorial magnetosonic waves observed by Cluster satellites: The Chirikov resonance overlap criterion
by Homayon Aryan (University of Sheffield)
Numerical codes modelling the evolution of the radiation belts often account for wave-particle interaction with magnetosonic waves. The diffusion coefficients incorporated in these codes are generally estimated based on the results of statistical surveys of the occurrence and amplitude of these waves. These statistical models assume that the spectrum of the magnetosonic waves can be considered as continuous in frequency space, however, this assumption can only be valid if the discrete nature of the waves satisfy the Chirikov resonance overlap criterion.
The Chirikov resonance overlap criteria describes how a particle trajectory can move between two resonances in a chaotic and unpredictable manner when the resonances overlap, such that it is not associated with one particular resonance [Chirikov, 1960]. It can be shown that the Chirikov resonance overlap criterion is fulfilled if the following equation is satisfied:
δθ = (vl / tanθm) / (1 - (ω2/vΩce2))
where θm is the mean angle between the propagation direction and the external magnetic field, δθ is the standard deviation of the wave propagation angles , l is the harmonic number, v=me/mp is the electron to proton mass ratio, and Ωce is the electron gyro-frequency [Artemyev et al., 2015].
Here we use Cluster observations of magnetosonic wave events to determine whether the discrete nature of the waves always satisfy the Chirikov resonance overlap criterion, extending a case study by Walker et al. [2015]. An example of a magnetosonic wave event is shown in panels a-c of the Figure. Panel d shows that the Chirikov overlap criterion is satisfied for this case. However, a statistical analysis shows that most, but not all, discrete magnetosonic emissions satisfy the Chirikov overlap criterion. Therefore, the use of the continuous spectrum, assumed in wave models, may not always be justified. We also find that not all magnetosonic wave events are confined very close to the magnetic equator as it is widely assumed. Approximately 75% of wave events were observed outside 3° and some at much higher latitudes ~21° away from the magnetic equator. This observation is consistent with some past studies that suggested the existence of low-amplitude magnetosonic waves at high latitudes. The results highlight that the assumption of a continuous frequency spectrum could produce erroneous results in numerical modelling of the radiation belts.
For more information please see the paper below:
, , , & ( 2019). Equatorial magnetosonic waves observed by Cluster satellites: The Chirikov resonance overlap criterion. Journal of Geophysical Research: Space Physics, 124. https://doi.org/10.1029/2019JA026680
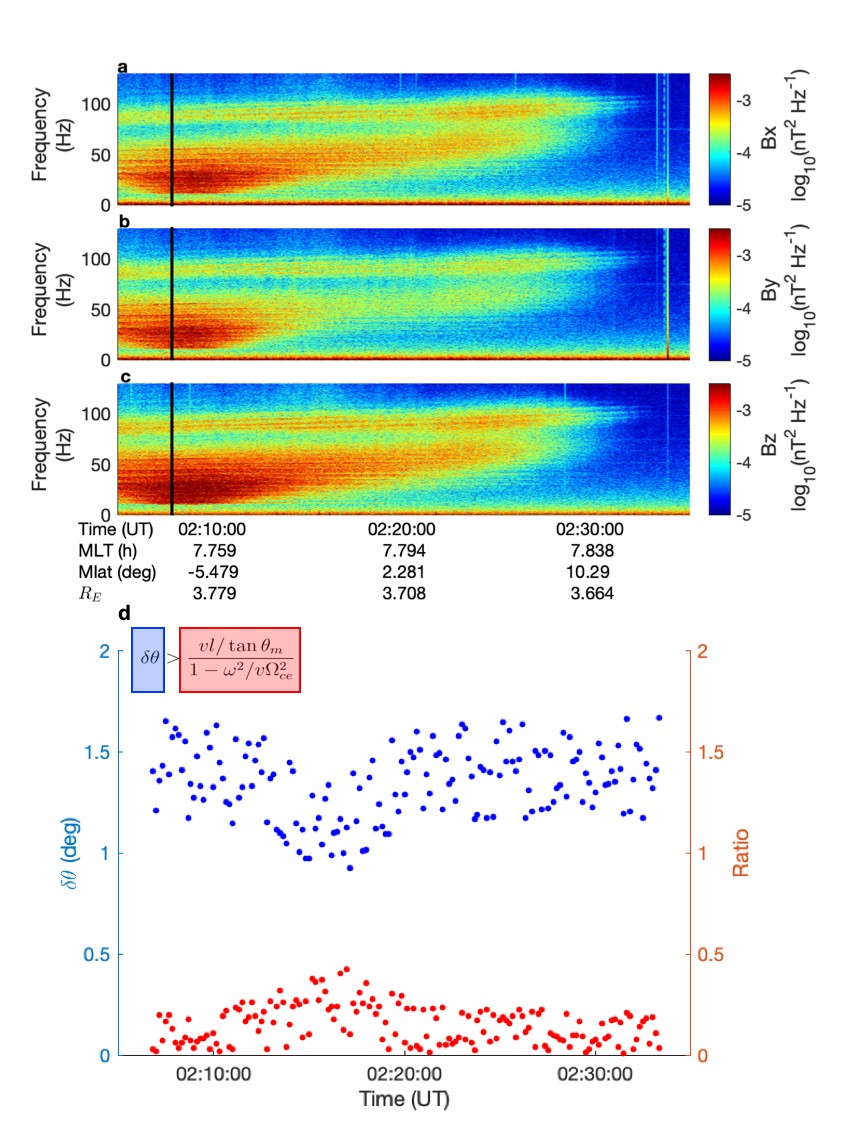
Figure: Observation of a magnetosonic wave event measured by Cluster 2 on 16 November 2006 at around 02:08 to 02:33~UT. The top three panels (a, b, and c) show the dynamic wave spectrogram (Bx, By, and Bz respectively) measured by STAFF search coil magnetometer. Panel d shows the analysis of the Chirikov resonance overlap criterion outlined in equation shown on top-left of the panel. The blue and red dots represent 10~s averaged values of dqand the ratio on the right hand side of equation respectively.