MIST
Magnetosphere, Ionosphere and Solar-Terrestrial
Nuggets of MIST science, summarising recent papers from the UK MIST community in a bitesize format.
If you would like to submit a nugget, please fill in the following form: https://forms.gle/Pn3mL73kHLn4VEZ66 and we will arrange a slot for you in the schedule. Nuggets should be 100–300 words long and include a figure/animation. Please get in touch!
If you have any issues with the form, please contact This email address is being protected from spambots. You need JavaScript enabled to view it..
The magnetopause booms like a drum due to impulses
by Martin Archer (Queen Mary University of London)
The abrupt boundary between a magnetosphere and the surrounding plasma, the magnetopause, has long been known to support surface waves which travel down the flanks. However, just like a stone thrown in a pond causes ripples which spread out in all directions, impulses acting on our magnetopause should also cause waves to travel towards the magnetic poles. It had been proposed that the ionosphere might result in a trapping of surface wave energy on the dayside as a standing wave or eigenmode of the magnetopause surface. This mechanism should act as a global source of magnetopause dynamics and ultra-low frequency waves that might then drive radiation belt and auroral interactions.
While many potential impulsive drivers are known, no direct observational evidence of this process had been found to date and searches for indirect evidence had proven inconclusive, casting doubt on the theory. However, Archer et al. (2019) show using all five THEMIS spacecraft during their string-of-pearls phase that this mechanism does in fact occur.
Figure: THEMIS observations and a schematic of the magnetopause standing wave.
They present observations of a rare isolated fast plasma jet striking the magnetopause. This caused motion of the boundary and ultra-low frequency waves within the magnetosphere at well-defined frequencies. Through comparing the observations with the theoretical expectations for several possible mechanisms, they concluded that the jet excited the magnetopause surface eigenmode – like how hitting a drum once reveals the sounds of its normal modes.
Hear the signals as audible sound here: https://www.youtube.com/watch?v=mcG03NBJf-s
For more information please see the paper below:
‘Direct Observations Of A Surface Eigenmode Of The Dayside Magnetopause’. M.O. Archer, H. Hietala, M.D. Hartinger, F. Plaschke, V. Angelopoulos. Nature Communications. | https://doi.org/10.1038/s41467-018-08134-5
Detecting the Resonant Frequency of the Magnetosphere with SuperDARN
by Samuel J. Wharton (University of Leicester)
The Earth’s magnetosphere is constantly being disturbed by ultralow frequency (ULF) waves. These waves transport energy and momentum through the system and can form standing waves on magnetospheric field lines. These standing waves have a resonant frequency which depends on the magnetic field strength and plasma distribution along the field line. The waves result in perturbations in the magnetic field and plasma in the ionosphere. These occur at the resonant frequency and can be directly observed with instruments on the ground. Being able to measure the resonant frequency can provide valuable information about the state of the magnetosphere.
Traditionally, this can be done by applying a cross-phase spectral technique to ground-based magnetometers. It works by finding the frequency where the phase change with latitude is most rapid. This occurs at the local resonant frequency.
The Super Dual Auroral Radar Network (SuperDARN) is a global consortium of 35 radars that observe radio waves backscattered from the ionosphere. The radars detect ULF waves by observing the movements of ionospheric plasma.
For the first time, we have applied the cross-phase technique to SuperDARN. These radars have a much greater spatial resolution and coverage and provide more detailed information than can be achieved with magnetometers alone. In this study, we have used some notable techniques, such as developing a Lomb-Scargle cross-phase technique for uneven data and exploiting an improved fitting procedure Reimer et al. (2018).
We have been able to apply these methods to several examples and validate the results with ground magnetometer estimations. When available, ionospheric heaters can be used to reduce the uncertainty in the backscatter location. However, the majority of SuperDARN data does not have a heater in the field of view and observes ‘natural scatter’. Figure 1 shows an example of the technique applied to natural scatter. The red band in Figure 1e lies at the resonant frequency. Hence, we can measure the resonant frequencies with and without an ionospheric heater.
This study demonstrates that SuperDARN can be used as a tool to monitor resonant frequencies and therefore the plasma distribution of the magnetosphere. This opens up a new application for the SuperDARN radars.
For more information, please see the paper below:
Wharton, S. J., Wright, D. M., Yeoman, T. K., & Reimer, A. S. (2019). Identifying ULF wave eigenfrequencies in SuperDARN backscatter using a Lomb-Scargle cross-phase analysis. Journal of Geophysical Research: Space Physics, 124. https://doi.org/10.1029/2018JA025859
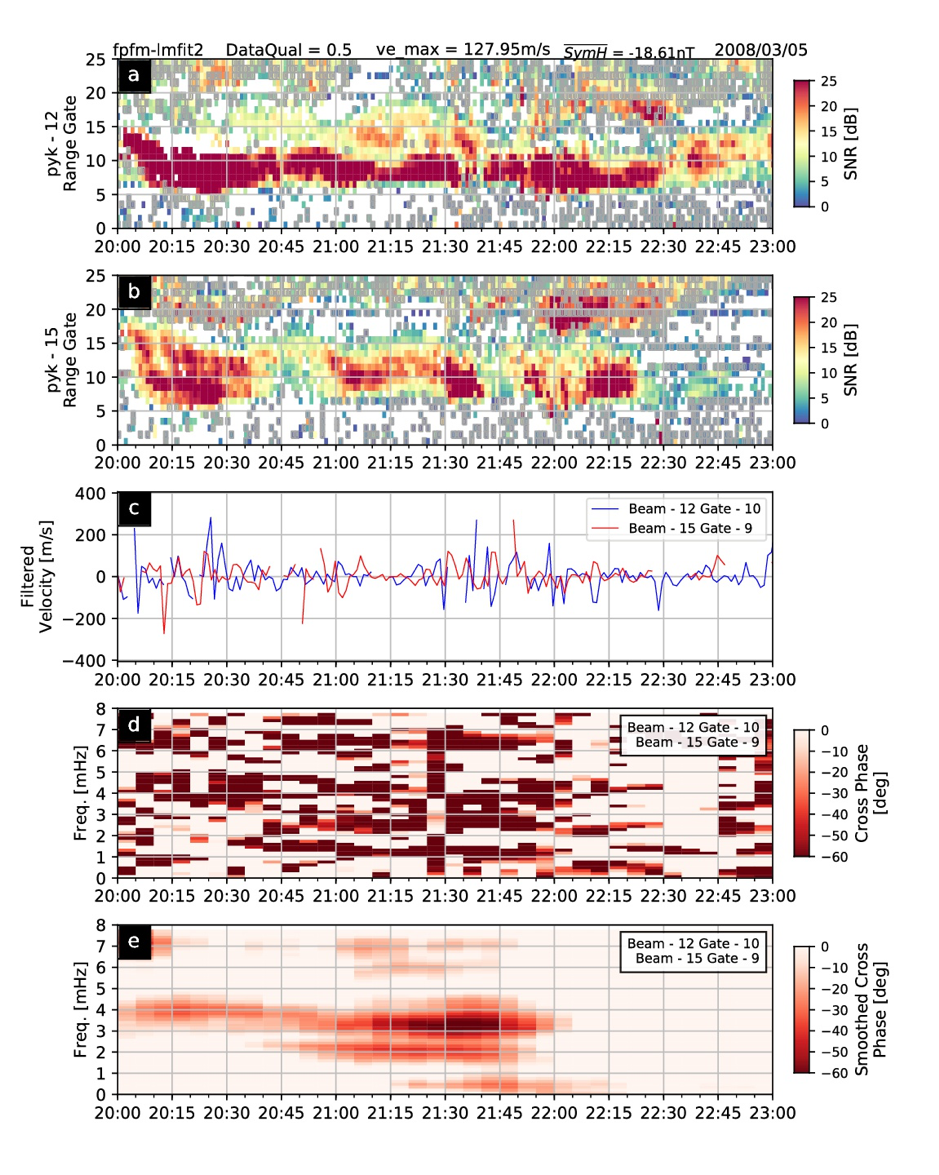
Figure 1: This shows an example of the local resonant frequency being measured by SuperDARN. (a) and (b) show range-time-intensity plots for beams 12 and 15 of the Þykkvibær radar. (c) shows filtered line-of-sight velocities for range gates 10 and 9 on those beams respectively. (d) The cross-phase spectrum for data in (c). (e) The cross-phase spectrum from (d) smoothed.
Current Density in Saturn’s Equatorial Current Sheet: Cassini Magnetometer Observations
by Carley J. Martin (Lancaster University)
Saturn’s rapidly rotating magnetosphere forms an equatorial current sheet that is prone to both periodic (i.e. flapping, breathing [see MIST nugget by Arianna Sorba]) and aperiodic movements (i.e. Martin & Arridge [2017]).
Although the current density of the sheet structure has been discussed by many previous authors, the current density in the middle to outer magnetosphere has not been fully explored. To this end we analysed aperiodic wave movements of Saturn’s current sheet, determined using Cassini’s magnetometer observations. The data were fitted to a deformed current sheet model in order to estimate the magnetic field value just outside of the current sheet, plus the scale height of the current sheet itself. These values were then used to calculate the height integrated current density.
We find a local time asymmetry in the current density, similar to the relationship seen at Jupiter, with a peak in current density of 0.04 A/m at ~ 3 SLT (Saturn Local Time). We then used the divergence of the azimuthal and radial current densities to infer the field-aligned currents that flow out from the equator pre-noon and enter the equator pre-midnight, similar to the Region-2 current at Earth. This current closure could enhance auroral emission in the pre-midnight sector by up to 11 kR.
Overall, the results provide important information into the asymmetries of the current sheet, and the characteristics of the current sheet suggest important field-aligned current systems that shape Saturn’s auroral emissions.
For more information, please see the paper below:
Martin, C. J., & Arridge, C. S. (2019). Current density in Saturn's equatorial current sheet: Cassini magnetometer observations. Journal Geophysical Researcher: Space Physics, 124, 279–292. https://doi.org/10.1029/2018JA025970
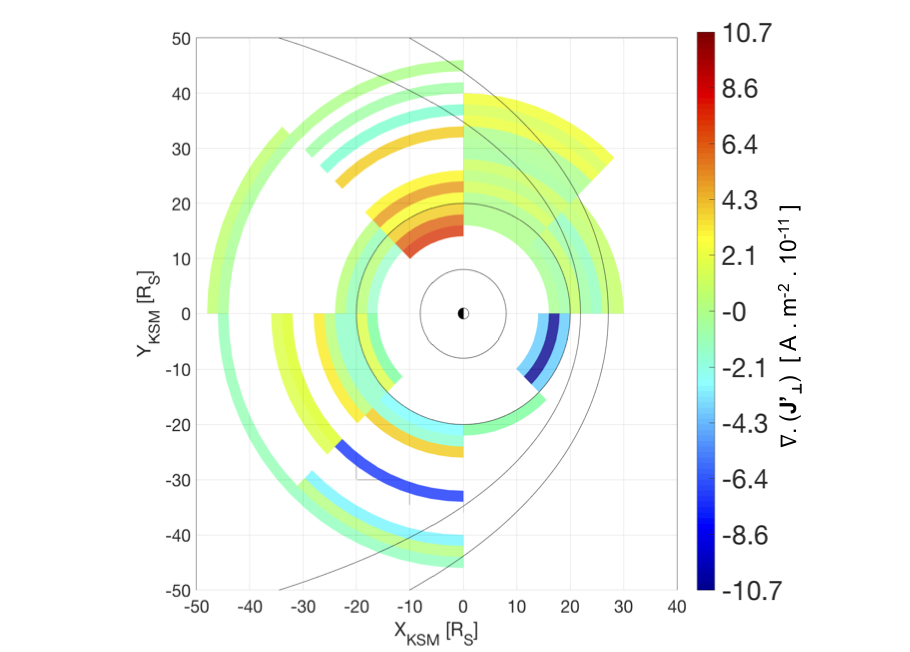
Figure: Divergence of height-integrated perpendicular current density (which infers the field-aligned current density). The coloured blocks show the average value of the divergence projected onto the X-Y plane in KSM (Kronocentric Solar Magnetospheric) coordinates. A range of magnetopause positions is shown using Arridge et at. (2006) along with the orbits of Titan (20 RS) and Rhea (9 RS), all shown in grey.
Observations of magnetic reconnection in Earth’s bow shock
by Imogen Gingell (Imperial College London)
The bow shock is a thin transition between super-sonic solar wind flows and sub-sonic flows in the Earth’s magnetosheath, during which the plasma is rapidly compressed and heated. In space plasmas, particle collisions cannot provide sufficient energy dissipation to slow the flow to sub-sonic speeds. Instead, nonlinear, electromagnetic plasma processes must be responsible.
Recent simulations (hybrid and fully kinetic particle-in-cell) have shown that current sheets and magnetic islands may be generated within the bow shock’s thin transition region (see Gingell et al 2017). This implies that magnetic reconnection, i.e. a localised change in the topology of the magnetic field, may be among the nonlinear processes responsible for heating in the shock transition layer. However, reconnection is not currently included in shock models.
Using data provided by NASA’s Magnetospheric Multiscale mission (MMS), we have now detected signatures of reconnection occurring at current sheets embedded in the shock. These signatures include a reversal of the magnetic field direction over ion inertial scales and a coincident super-Alfvénic jet of electrons corresponding the outflow from the reconnection site (see Fig 1). The increase in the electron temperature is consistent with previous observations of reconnection at the magnetopause. However, the lack of an ion jet or heating is similar to recent observations within the magnetosheath.
Now that we have confirmed that reconnection can occur within the bow shock, we must assess the broader impact of reconnection on heating and particle acceleration at shocks, explore the evolution of reconnecting structures as they convect downstream, and determine the parameter regime over which shock reconnection can occur.
For more information, please see the paper below:
Gingell, I., Schwartz, S. J., Eastwood, J. P., Burch, J. L., Ergun, R. E., Fuselier, S., et al. (2019). Observations of magnetic reconnection in the transition region of quasi‐parallel shocks. Geophysical Research Letters, 46. https://doi.org/10.1029/2018GL081804
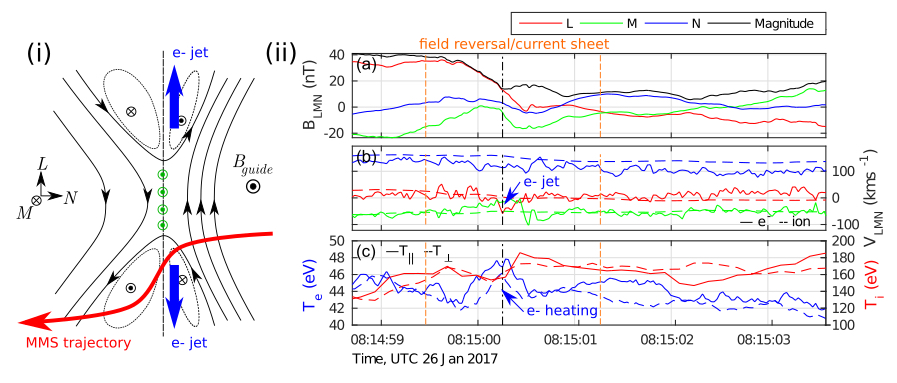
Fig 1. (i) schematic of the structure of a reconnecting current sheet, showing magnetic field (black), current density (green), electron outflow jets (blue) and spacecraft trajectory for the observed event (red). (ii) observations of a current sheet in the bow shock, showing (a) magnetic field, (b) electron and ion bulk velocities, and (c) electron ion temperatures.
The surprisingly variable current system inside Saturn’s D ring
by Gabby Provan & Stan Cowley (University of Leicester)
During Cassini’s Grand Finale, the spacecraft made 22 daring “proximal” periapsis passes between the denser layers of Saturn’s upper atmosphere and the inner edge of the planet’s innermost D ring (Figure 1a). This region had never previously been explored. On every pass Cassini’s magnetometer observed unanticipated perturbations in the azimuthal magnetic field component, confined to field lines that pass through and inside of the D ring in the equatorial plane, peaking typically at a few tens of nano-Tesla. Since the fields are near-symmetric about the magnetic equator, they are consistent with interhemispheric currents flowing along the near-equatorial magnetic field lines, as illustrated in Figure 1b.
Here we examine the azimuthal field perturbations on all the proximal passes, and show that they are surprisingly variable in form and magnitude. While a third of the passes indicate a unidirectional current flow, and a further third shows multiple sheets of oppositely-directed currents. The remaining passes present diverse signatures, including two passes showing reverse currents, and two with only small and fluctuating perturbations. This variability is not related to the spacecraft trajectory or organized by any known rotational period of the Saturnian system (i.e. the phase of the Saturn’s planetary period oscillations or the rotational phase of the D68 ringlet).
Khurana et al. (2018) suggested that these currents are generated by differential zonal thermospheric wind drag acting in the ionosphere at the two ends of these inner field lines. If so, these results show that either Saturn’s ionospheric zonal winds or ionospheric conductivity, or both, are very variable over the ~6.5 day orbital period of these periapsis passes. Our results add to the body of evidence showing that there is a significant and variable dynamical interaction between the material in Saturn’s D ring and the planet’s equatorial atmosphere.
For more information, please see the paper below:
Provan, G., Cowley, S. W. H., Bunce, E. J., Bradley, T. J., Hunt, G. J., Cao, H., & Dougherty, M. K. (2019). Variability of intra–D ring azimuthal magnetic field profiles observed on Cassini's proximal periapsis passes. Journal of Geophysical Research: Space Physics, 124. https://doi.org/10.1029/2018JA026121
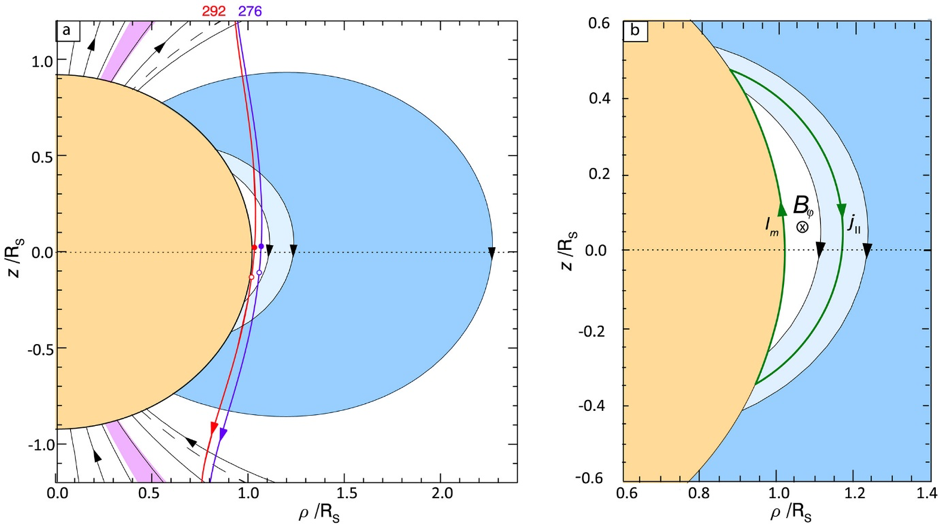
Figure 1: (a) The spacecraft trajectory of two example proximal passes. The planet is shown in orange, and the arrowed black lines show model magnetic field lines. The A to C rings are shown in dark blue, and the D ring in lighter blue. The suggested intra-D ring current system is shown in green in panel (b).