MIST
Magnetosphere, Ionosphere and Solar-Terrestrial
Nuggets of MIST science, summarising recent papers from the UK MIST community in a bitesize format.
If you would like to submit a nugget, please fill in the following form: https://forms.gle/Pn3mL73kHLn4VEZ66 and we will arrange a slot for you in the schedule. Nuggets should be 100–300 words long and include a figure/animation. Please get in touch!
If you have any issues with the form, please contact This email address is being protected from spambots. You need JavaScript enabled to view it..
The relative prevalence of wave-packets and coherent structures in the inertial and kinetic ranges of turbulence as seen by Solar Orbiter
By Alina Bendt (CFSA, University of Warwick)
The in-situ measurements of the solar wind by Solar Orbiter provide the opportunity to study turbulence at very high Reynolds numbers in a nearly collissionless plasma. Turbulence is a potential contributor to the heating, structure, and dynamics of the solar wind. With Solar Orbiter it is now possible to study the evolution of solar wind turbulence. We use Solar Orbiter observations of nine extended intervals of homogeneous turbulence to determine under what conditions turbulent magnetic field fluctuations may be characterized as: (i) wave-packets and (ii) coherent structures. We perform the first systematic scale-by-scale decomposition of the magnetic field using two wavelets known to resolve wave-packets and discontinuities, the Daubechies 10 and Haar respectively. We compare the functional forms of the fluctuation probability distributions obtained from these wavelet decompositions via quantile-quantile plots. The comparison of the fluctuation pdfs between the two wavelets reveals three distinct regimes of behaviour and establishes a crossover range between wave-packet and coherent structure phenomenology in the inertial and kinetic ranges. The crossover range is seen to exhibit a distinct 2-component functional form. And the behaviour of the crossover range depends on the heliocentric distance and field alignment angle. As coherent structures and wave-wave interactions are both candidates to mediate the turbulent cascade, these results offer new insights into the distinct physics of the inertial and kinetic ranges.
 comparison between Haar and Db10 wavelet decompositions of the magnetic field. Pdfs are shown for $B_{\perp (V_{sw}\times B)}$ for four example intervals (rows). The chosen intervals (top down) are at $0.989$ au with $\beta=0.95$ and $\theta=18.07$°, at $0.934$ au with $\beta=2.08$ and $\theta=160.93$°, at $0.597$ au with $\beta=2.48$ and $\theta=68.63$°, and at $0.37$ au with $\beta=0.76$ and $\theta=16.82$°. The scales shown are increasing from left to right at $0.25$, $0.5$, $2$ and $8$ s. Empty purple circles are obtained from the Db10 wavelet decomposition, while green circles are from the Db10 wavelet decomposition. The pdfs are normalised by bin width and overall number of samples of magnetic field data. The number of bins is scaled by the standard deviation $\sigma$ at the corresponding scale and bins with less than $10$ counts are discarded. The error is estimated as $\sqrt{n}$, where $n$ is the bin count, error bars are too small to be resolved visually.")
Probability distribution functions (pdfs) comparison between Haar and Db10 wavelet
decompositions of the magnetic field. Pdfs are shown for Bperp(Vsw ⋅ B)} for four
example intervals (rows). The chosen intervals (top down) are at 0.989 au with β=0.95
and θ=18.07°, at 0.934 au with β=2.08 and θ=160.93°, at 0.597 au with β=2.48 and θ=68.63°,
and at 0.37 au with β=0.76 and θ=16.82°. The scales shown are increasing from left to right
at 0.25, 0.5, 2 and 8 s. Empty purple circles are obtained from the Db10 wavelet decomposition,
while green circles are from the Db10 wavelet decomposition. The pdfs are normalised by bin
width and overall number of samples of magnetic field data. The number of bins is scaled by
the standard deviation σ at the corresponding scale and bins with less than 10 counts are
discarded. The error is estimated as √n, where ν is the bin count, error bars are too small to
be resolved visually.
See publication for further information:
Bendt, A., Chapman, S. C., Dudok de Wit, T. (2024). The relative prevalence of wave packets and coherent structures in the inertial and kinetic ranges of turbulence as seen by Solar Orbiter. The Astrophysical Journal, 971:179.
https://iopscience.iop.org/article/10.3847/1538-4357/ad54bc
A new model of electron pitch angle distributions and loss timescales in the Earth's radiation belts
By Sarah Glauert (British Antartic Survey)
Pitch angle distributions (PADs) are widely used in radiation belt modelling, for example, to create boundary conditions, to map observations from low to high equatorial pitch angles and to calculate phase-space density from observations. In the SWIMMR Sat-Risk project we needed them to map observations made at higher latitudes to the equator. As we couldn’t find a comprehensive enough model in the literature, we developed our own. The technique we used to derive the PADs also provides a loss timescale (used in radial diffusion models), so we also obtained a model for loss timescales. The new models are calculated from drift-averaged diffusion coefficients that represent all the VLF waves that typically interact with radiation belt electrons and cover 2 ≤L*≤7, 100 keV ≤ E ≤ 5 MeV and all levels of geomagnetic activity defined by the Kp index. They show good agreement with observations and the contribution of individual waves is demonstrated: magnetosonic waves have little effect on loss timescales when lightning-generated whistlers are present and chorus waves contribute to loss even in low levels of geomagnetic activity. The shape of the PADs depends on the dominant waves. When chorus is dominant the PADs have little activity dependence, unlike the corresponding loss timescales. Distributions peaked near 90o are formed by plasmaspheric hiss for L*≤3 and E < 1 MeV, and by EMIC waves for L*> 3 and E >1 MeV. When hiss dominates, increasing activity broadens the distribution but when EMIC waves dominate increasing activity narrows the distribution.
 for 0 ≤ Kp < 2 (purple), 2 ≤ Kp ≤ 4 (cyan) and Kp> 4 (yellow).")
Normalised, drift-averaged pitch angle distributions for the given L* and energies.
Purple lines show PADs for 1 ≤Kp< 2, cyan for 3 ≤Kp< 4 and yellow for 5 ≤Kp< 6. The dotted lines
are distributions derived from observations in Allison et al. (2018) for 0 ≤ Kp < 2 (purple),
2 ≤ Kp ≤ 4 (cyan) and Kp> 4 (yellow).
See publication for further information:
Glauert, S. A., Atkinson, J. W., Ross, J. P., & Horne, R. B. (2024). A new model of electron pitch angle distributions and loss timescales in the Earth's radiation belts. Journal of Geophysical Research: Space Physics, 129, e2023JA032249.
https://doi.org/10.1029/2023JA032249
Energetic Proton Losses Reveal Io's Extended and Longitudinally Asymmetrical Atmosphere
By Hans Huybrighs (Dublin Institute for Advanced Studies)
Io is a moon of Jupiter with active volcanoes and an atmosphere of which the structure and variability is poorly understood. A fascinating object on its own, neutral gas from Io also serves as the main source of plasma in Jupiter's magnetosphere. Improving our understanding of Io's atmosphere will allow us to better understand the precise link between Io's neutral environment and the plasma torus surrounding Jupiter. In this work we analyse data from the historic Galileo spacecraft that encountered Io. Specifically, we analyse regions close to Io where losses of energetic protons occur.
Using a comparison between the Galileo data and particle tracing model we find that charge exchange between the protons and Io's atmosphere along with the effect of the electric and magnetic fields can cause the measured decreases. We show that charge exchange with the atmosphere is either a major or the dominant cause of the losses, depending on the flyby altitude. The distributions of the proton loss region are related to the structure of Io’s atmosphere and hint at an atmosphere that is more extended on Io's day side (also the downstream side from the plasma flow's point of view), doesn't collapse fully on the night (upstream) side, and appears to be more extended than we assumed.

See publication for further information:
, , , , , & (2024). Energetic proton losses reveal Io's extended and longitudinally asymmetrical atmosphere. Journal of Geophysical Research: Space Physics, 129, e2023JA032371. https://doi.org/10.1029/2023JA032371
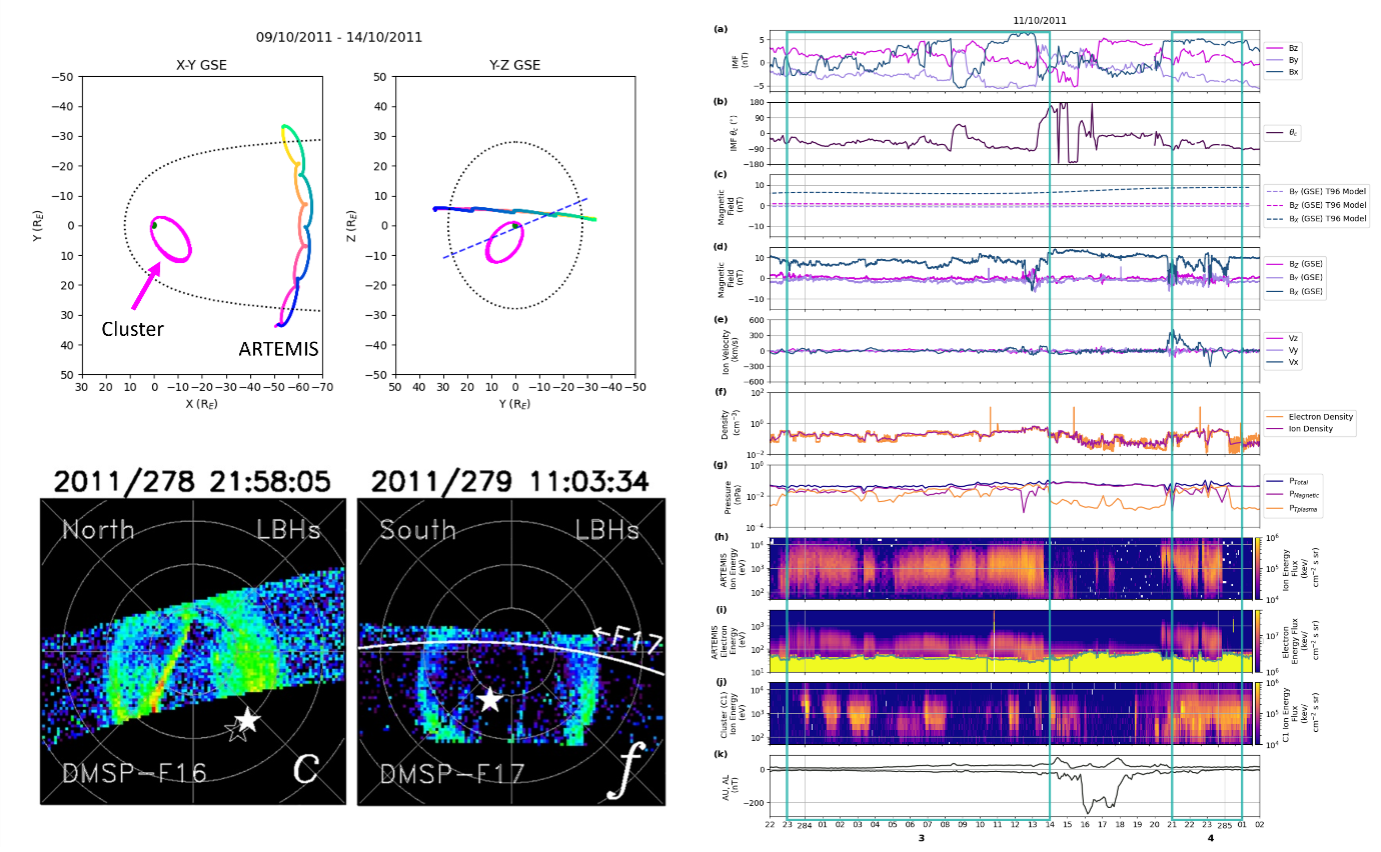
Plasma observations in the high-latitude and distant magnetotail associated with cusp-aligned arcs during intervals of northward IMF
By Michaela Mooney and Steve Milan (University of Leicester)
During periods of northward interplanetary magnetic field (IMF), the magnetospheric structure and dynamics are dramatically different and less understood compared to the southward IMF case.
Under northward IMF magnetic reconnection occurs at higher latitudes tailward of the cusp, known as lobe reconnection (Dungey, 1963). Lobe reconnection can occur on the same IMF field line in both hemispheres, known as dual lobe reconnection. It is thought that dual lobe reconnection can result in either the partial or complete closure of the magnetosphere (Milan et al., 2022). The auroral oval is also contracted to higher latitudes reflecting the reduced open flux content of the magnetosphere. The auroral emission is dimmer and distinct auroral features are observed poleward of the auroral oval such as cusp-aligned arcs, horse collar aurora and transpolar arcs.
Using Cluster and ARTEMIS in-situ data, we examined a period of prolonged northward IMF during which multiple instances of cusp-aligned arcs were observed poleward of the auroral oval. The Cluster observations showed trapped plasma on closed flux in the high latitude magnetotail (|ZGSE| ~ 13 RE) in regions which would typically be expected to be open magnetotail lobe void of plasma under southward IMF. Meanwhile, the ARTEMIS spacecraft observed simultaneous high electron and ion fluxes in the distant magnetotail (XGSE ~ - 60 RE). The plasma in both magnetotail regions was observed coincidently with observations of cusp-aligned arcs in the auroral data. We interpret these observations of trapped plasma on closed field lines as providing the source population for the cusp-aligned arc emission in the polar region.
During this interval we suggest that the magnetosphere was almost entirely closed as a result of dual lobe reconnection. The magnetotail is closed or partially closed but extends at least as far as ∼ 60 RE downtail. The occurrence of plasma in the magnetotail and the closure of the magnetosphere resulted in distinct changes to the magnetotail structure including a reduction in the magnetic field strength and pressure as well as a narrowing of the tail by approximately 20 RE.
See the full papers for further details:
Milan, S. E., Mooney, M. K., Bower, G. E., Taylor, M. G. G. T., Paxton, L. J., Dandouras, I., et al. (2023). The association of cusp-aligned arcs with plasma in the magnetotail implies a closed magnetosphere. Journal of Geophysical Research: Space Physics, 128, e2023JA031419. https://doi. org/10.1029/2023JA031419
Mooney, M. K., Milan, S. E., & Bower, G.E. (2024). Plasma observations in the distant magnetotail during intervals of northward IMF. Journal of Geophysical Research: Space Physics, 129,e2023JA031999. https://doi.org/10.1029/2023JA031999
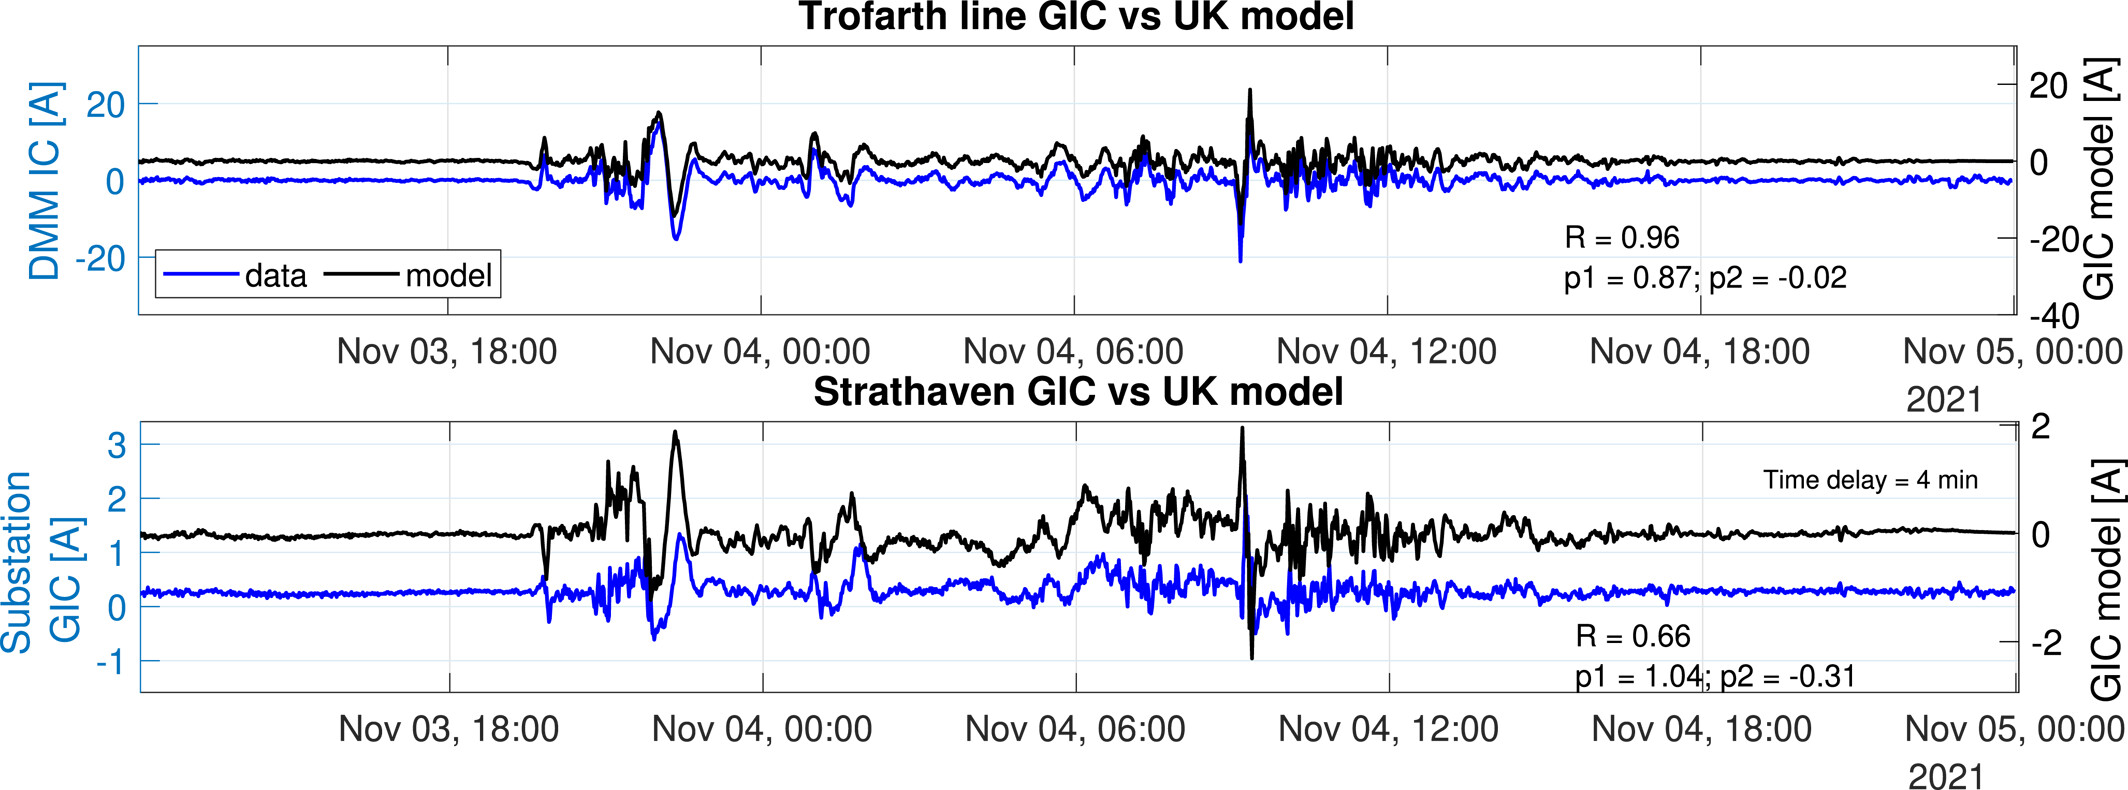
Validating GIC models in the UK using Differential Magnetometer and Magnetotelluric Data
By Juliane Huebert (British Geological Survey)
Geomagnetically induced currents (GICs) are a well-known consequence of increased geomagnetic activity due to solar storms. They pose the risk of damaging ground-based infrastructure like the high voltage power transmission network, gas pipelines and railways. Large-scale models of GICs in the UK exist, taking into account geomagnetic data, the induced ground electric fields and the configuration of the ground-based technologies. Validating these complex models is not easy and requires independent observations. To measure GICs in the HV voltage power network, we applied the Differential Magnetometer Method (DMM) at several sites in Britain. At each site, one magnetometer was placed under the power lines while a second one was located a few hundred meters away. By looking at the difference in the data between the two we can isolate the direct current flowing in the power lines. Data were recorded for several months, catching periods of increased geomagnetic activity. We then compared the measured current strength to the BGS GIC model developed from open source data sets of the UK power grid. The model also uses a measure for the ground electrical conductivity that is based on so-called magnetotelluric (MT) measurements which we performed in a country-wide campaign. MT data is necessary to characterize the spatial changes in the ground electric field due to local geology. We found our model and the field measurements to match very well, giving confidence that our simulations of the whole UK grid are very close to the correct values.
See full paper for further details:
Hübert, J., Beggan, C. D., Richardson, G. S., Gomez-Perez, N., Collins, A., & Thomson, A. W. P. (2024). Validating a UK geomagnetically induced current model using differential magnetometer measurements. Space Weather, 22, e2023SW003769. https://doi.org/10.1029/2023SW003769