MIST
Magnetosphere, Ionosphere and Solar-Terrestrial
Determination of the Equatorial Electron Differential Flux From Observations at Low Earth Orbit
By Hayley J. Allison, British Antarctic Survey / University of Cambridge, UK.
Electrons trapped on the terrestrial magnetic field form the Earth’s electron radiation belts. The dynamics of these structures can be examined using numerical models such as the BAS Radiation Belt Model. Recent work has highlighted the link between increases in the low energy seed population (tens to hundreds of keV electrons) and high-energy relativistic electron flux enhancements in the radiation belts. However, data on the seed population is limited to a few satellite missions.
Low earth orbit satellites, such as the Polar Operational Environmental Satellites (POES), rapidly sample the radiation belt region and provide a wealth of observations of the electron environment. Here we present a method to utilise this dataset to develop event-specific low energy boundary conditions for the British Antarctic Survey 3-D Radiation Belt Model. Such a method can supply realistic low energy boundary conditions for periods outside the Van Allen Probes mission, with a broad magnetic local time coverage.
Using the low energy POES observations presents two main challenges. Firstly, the electron populations measured by the POES satellites are of low equatorial pitch angle. Secondly, the SEM-2 detector supplies integral electron flux, i.e. including all electrons from a lower energy limit up to a threshold. We used activity dependent equatorial pitch angle distributions, derived from Van Allen Probes observations, to map the POES observations to higher pitch angles and explore two methods for obtaining the flux at various electron energies (differential flux) from the integral flux measurements.
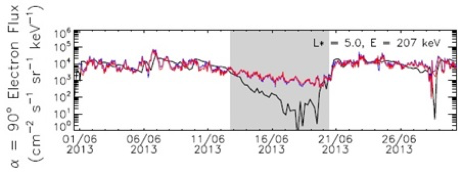
The resulting equatorial electron differential flux values were validated against MagEIS observations and showed an average agreement within a factor of 4 for L* > 3.7 when the assumption that electron flux decreased with increasing energy held (white areas in figure). Variations in the MagEIS flux tend to be reproduced in the converted POES dataset. Periods when the electron flux did not fall with energy (shaded grey) were primarily during quiet times when a lack of chorus wave activity meant that these low energy electrons were not accelerated to >900 keV energies.
For more information, please see the paper below:
Allison, H. J., Horne, R. B., Glauert, S. A., & Del Zanna, G. (2018). Determination of the equatorial electron differential flux from observations at low Earth orbit. Journal of Geophysical Research: Space Physics, 123. https://doi.org/10.1029/2018JA025786

Figure: Comparison of the Van Allen Probes Magnetic Electron Ion Spectrometer electron flux (black lines) at five L* values, for energies following a line of constant μ = 100 MeV/G and the electron flux determined from the POES observations using the AE-9 distributions for the integral flux to differential conversion (red line) and using the iterative approach (blue line). Grey regions show periods when the assumptions that the electron flux falls with increasing energy were violated.
