MIST
Magnetosphere, Ionosphere and Solar-Terrestrial
SuperDARN Observations During Geomagnetic Storms, Geomagnetically Active Times, and Enhanced Solar Wind Driving
by Maria-Theresia Walach (Lancaster University)
At Earth, solar wind coupling drives large scale convection of field lines: antisunward flow of open field lines at high latitudes and the return flow of closed field lines at lower latitudes. This convection can be observed through measurements of the ionosphere, for example using measurements from SuperDARN, an international network of ground based radars, purposely built to study ionospheric convection. We use 7 years of Super Dual Auroral Radar (SuperDARN) data to study ionospheric convection during geomagnetic storms, geomagnetically active times and solar wind driven times. Using the most recent years of SuperDARN data allows us to study ionospheric convection at the mid-latitudes with a field-of-view spanning from the pole to 40 degrees of magnetic latitude.
In this study, we address a number of questions; for example, do we make similar SuperDARN observations during similar solar wind driving during nonstorm time as during storm time? Do SuperDARN observations change throughout the different phases of a storm? Where do we see the fastest flows with SuperDARN, and is it linked to the extent of latitudinal coverage from the radars? Does the latitudinal range of the convection, given, for example, by the return flow region, stay constant throughout a storm? We find that initial and recovery phases of geomagnetic storms show similar convection as enhanced solar wind driving when no geomagnetic storm occurs.
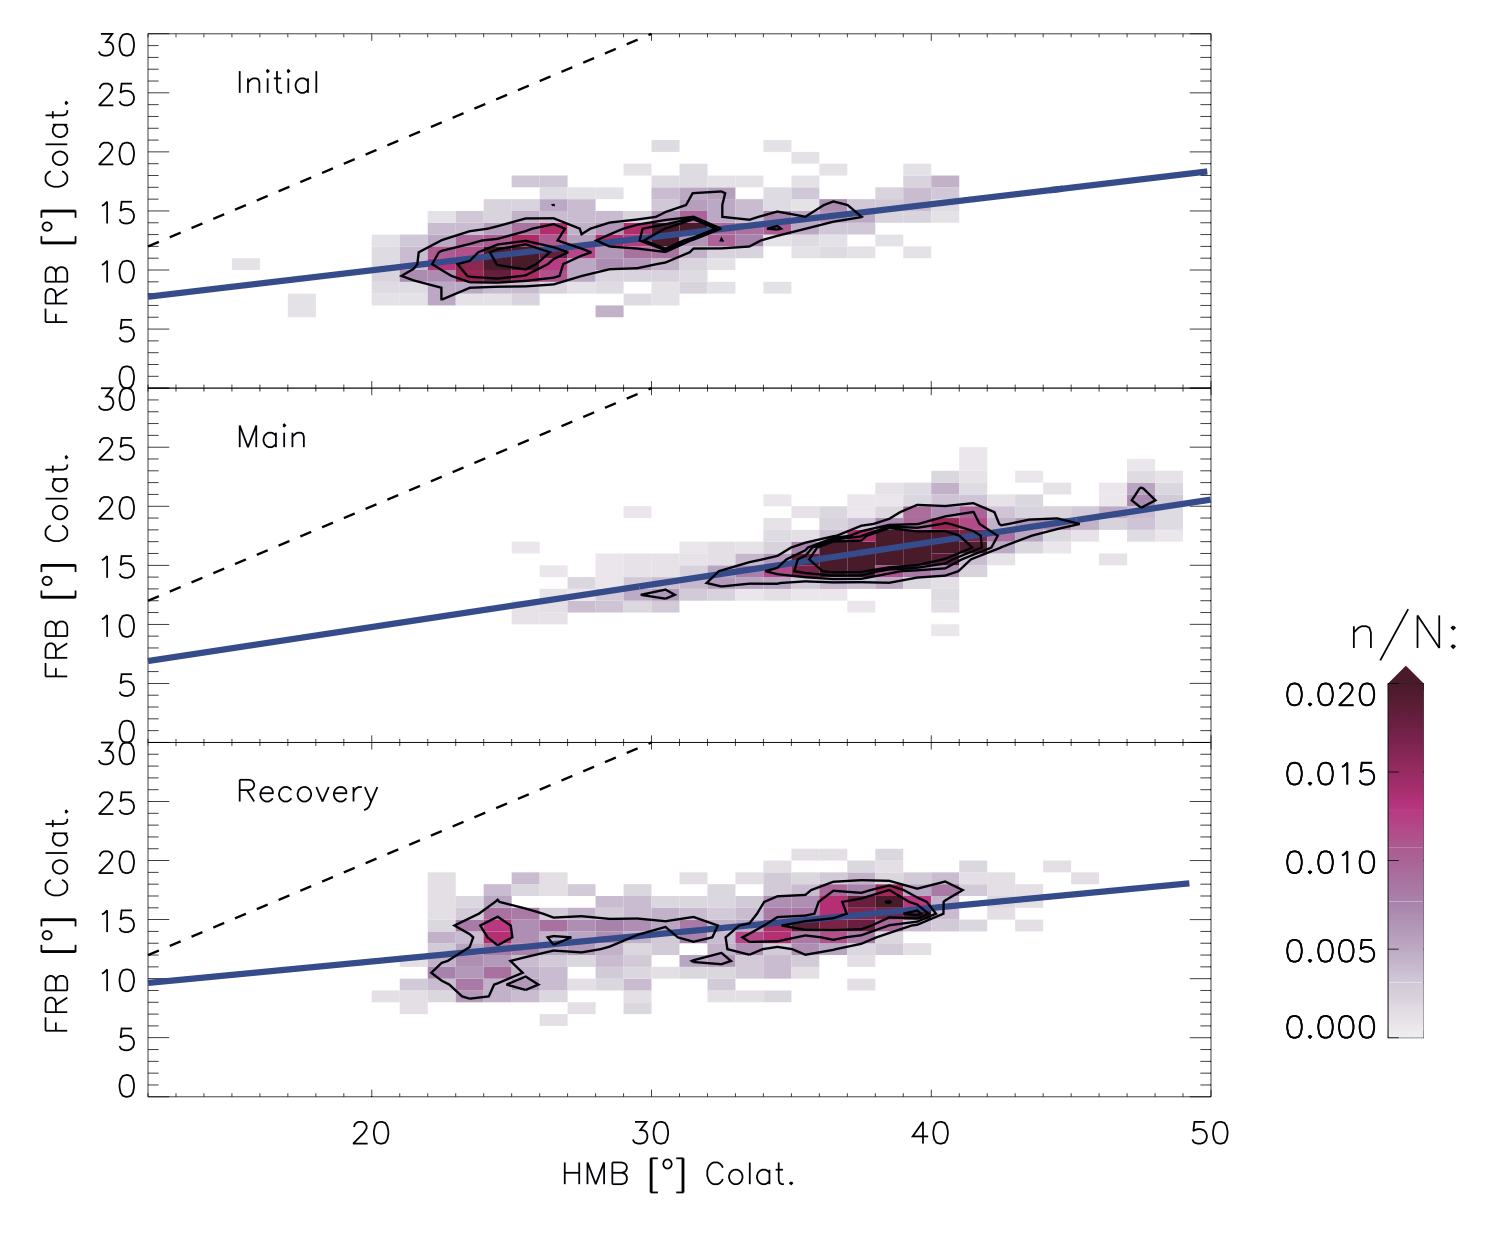
One of the key findings showing the change of regime between the initial, main, and recovery phase of the storm is shown in the figure: it shows the varying relationship between the flow reversal boundary (here FRB but otherwise known as the open-closed field line boundary or polar cap boundary) and the Heppner-Maynard boundary (here HMB, which corresponds to the lower latitude boundary where the ionospheric convection electric field approaches 0 kV). The blue line shows the line of best fit and the data distribution along it, indicates that the boundaries must expand and contract together, however, this happens at different rates during the different storm phases, producing an inflated return flow region during the main phase of the storm.
For more information, please see the paper below:
, & ( 2019). SuperDARN observations during geomagnetic storms, geomagnetically active times, and enhanced solar wind driving. Journal of Geophysical Research: Space Physics, 124. https://doi.org/10.1029/2019JA026816

Figure: Colatitude location of the flow reversal boundary (FRB) against the Heppner‐Maynard boundary (HMB) during the three phases of geomagnetic storms (only using maps where n ≥ 200). The dashed black lines show the line of unity and the black contours correspond to where the normalized data point density corresponds to 0.005, 0.01, 0.015, and 0.02.