MIST
Magnetosphere, Ionosphere and Solar-Terrestrial
Pro‐L* ‐ A probabilistic L* mapping tool for ground observations
By Rhys Thompson (University of Reading)
Both ground and space observations are used extensively in the modeling of space weather processes within the Earth's magnetosphere. The shape of the magnetic field is not fixed, however, and there is not a consistent relationship between the footprint location of a ground measurement and its respective position in space. With no way to validate the global true magnetic field, numerous models exist to approximate it, allowing a subset of locations on the ground (mainly sub‐auroral) to be mapped along field lines to a location in space.
We often envision the radiation belts in a fixed coordinate system representative of the motions of the trapped particles. Often considered a proxy for distance is L*, a quantity related to the radial motion of electrons. Once an observation's respective location in the magnetic field is approximated it can be transformed into L*, provided the electrons at the measurement's physical location remain trapped by the Earth’s magnetic field.
Dependency of L* on magnetic field model accuracy is therefore paramount, however these models can significantly disagree on mapped L* values for a single point on the ground, during both quiet times and storms.
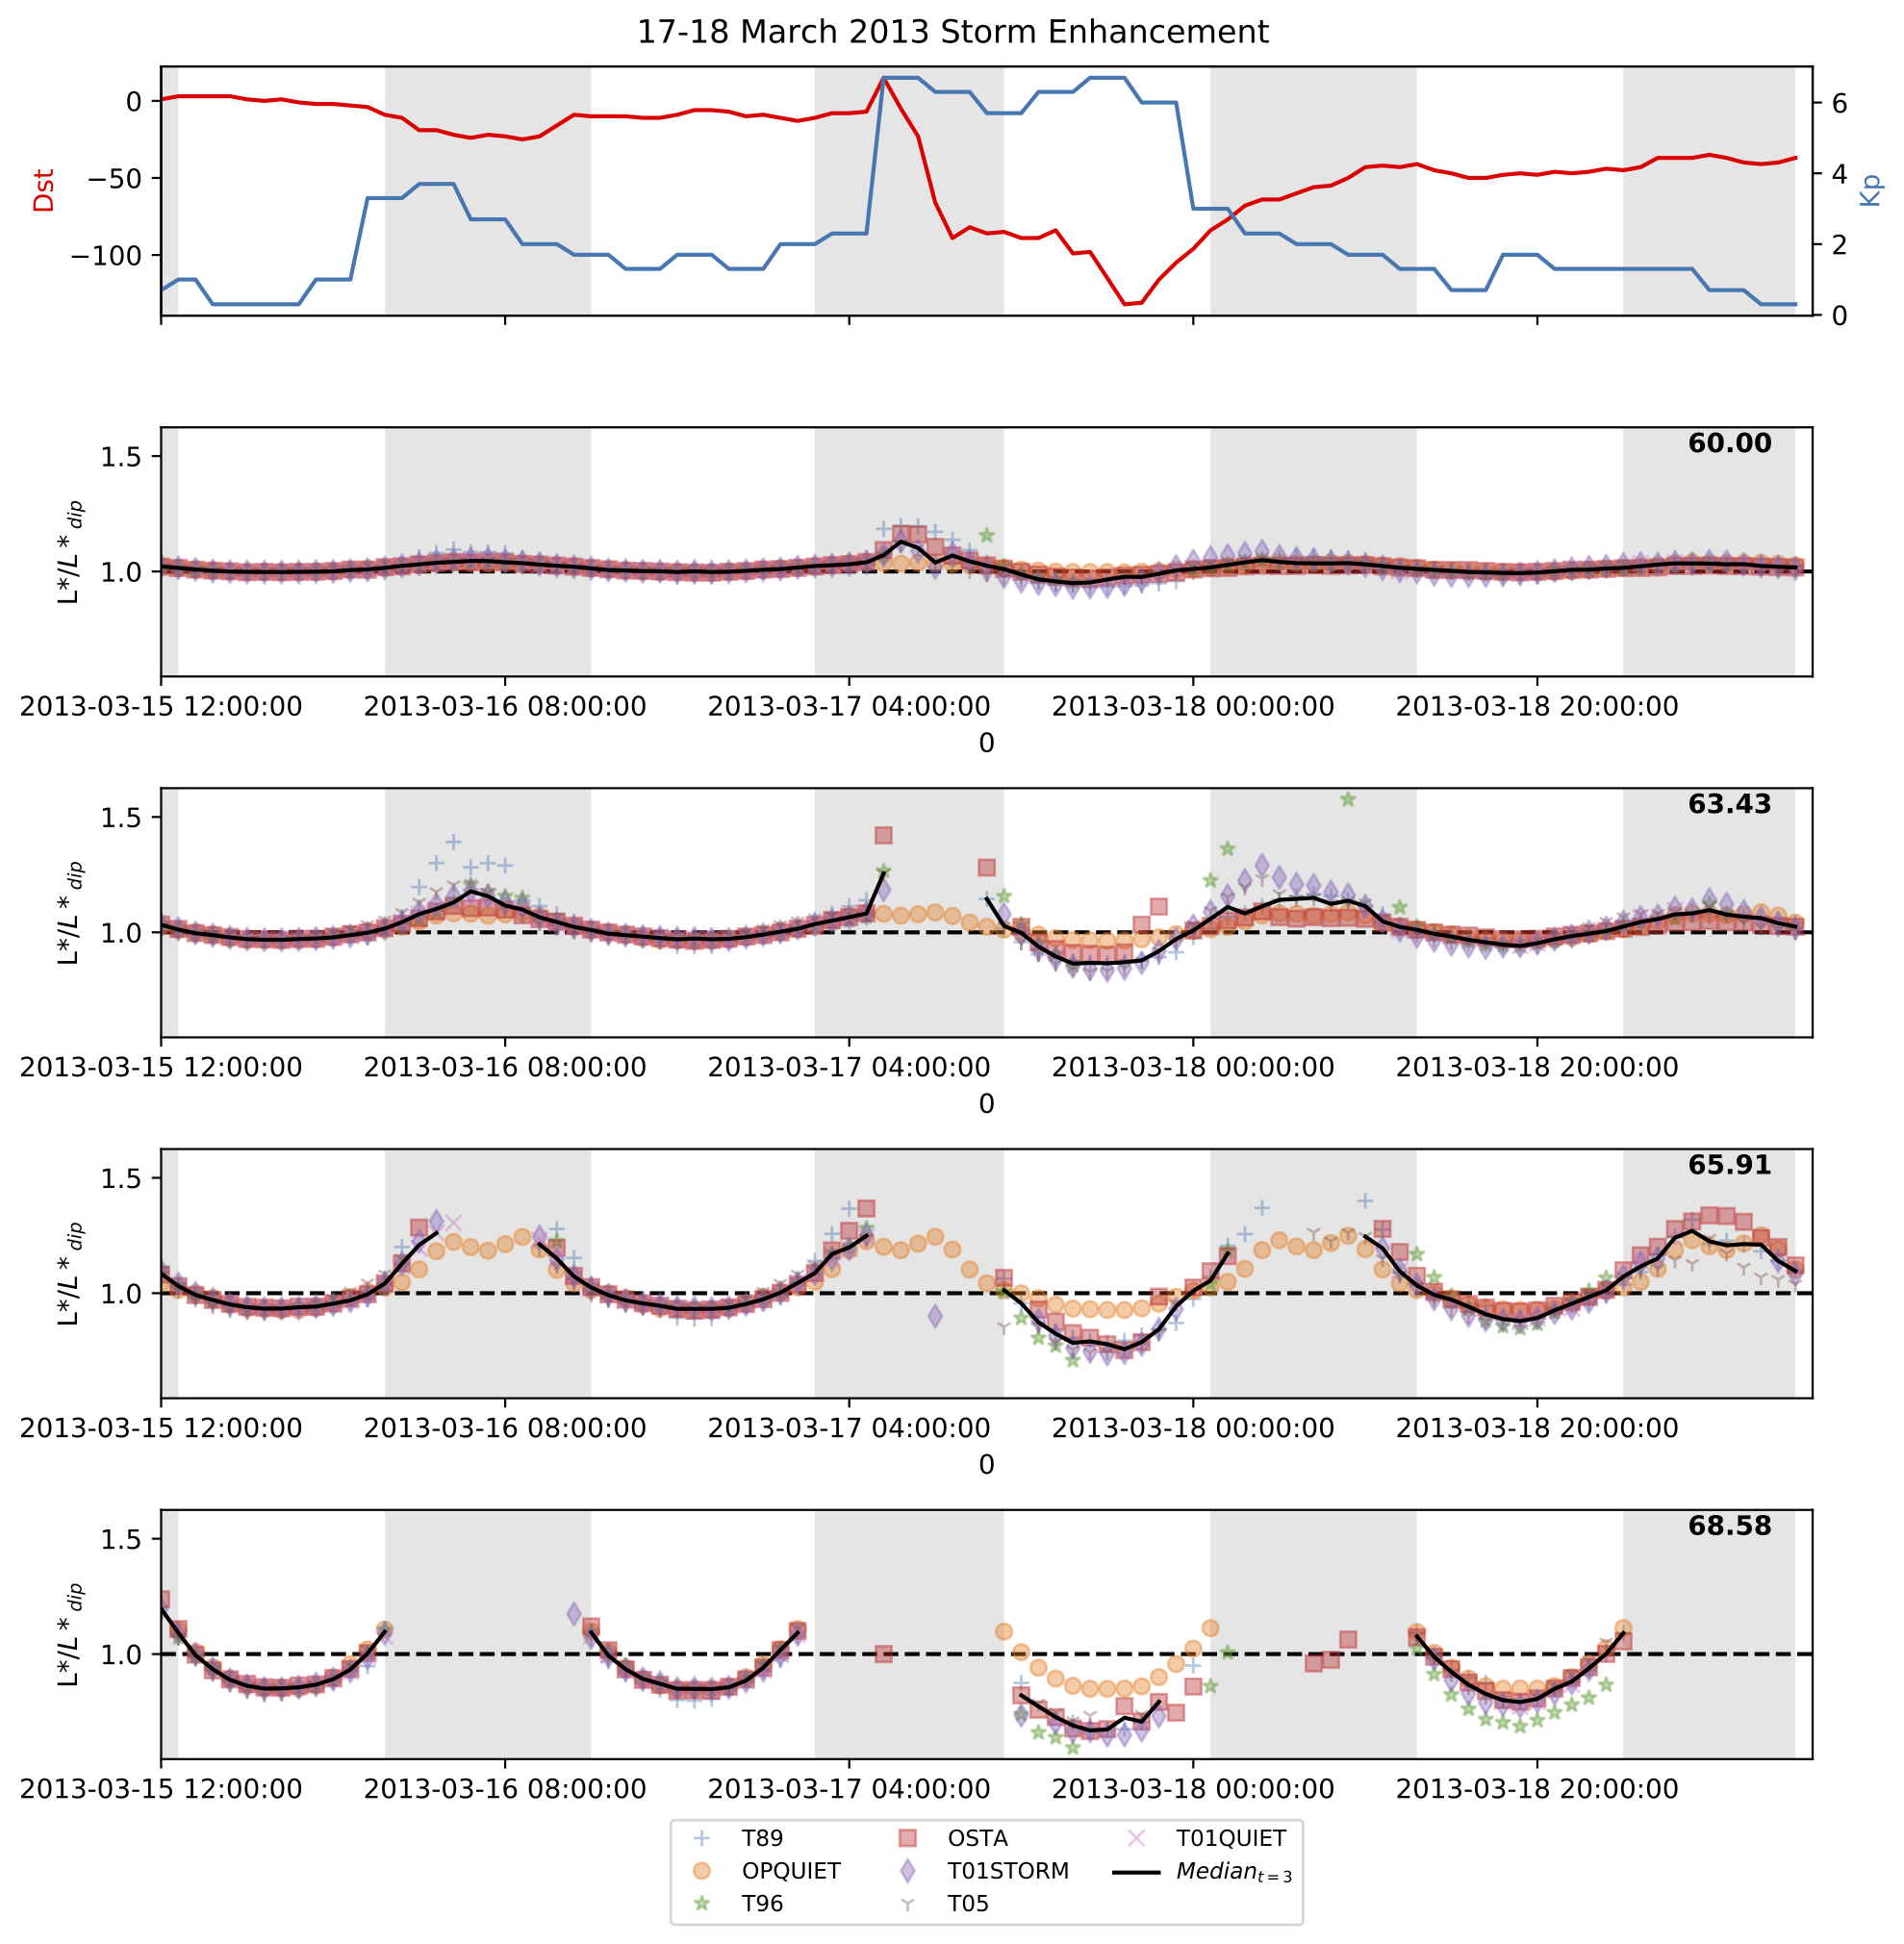
We present a state‐of‐the‐art tool, Pro‐L*, which for any ground observation provides the probabilities of corresponding L* values. Usage is highlighted for both event studies (a simple demonstration can be seen in Figure 1) and statistical models, and we demonstrate a number of potential applications. Pro-L* may be accessed as a freely available Python package at https://github.com/Rhyst223/pro-lstar.git.

Figure 1: The L* response of magnetic field models to the 17-18 March 2013 storm enhancement, for a selection of magnetic latitudes at 330 degrees magnetic longitude, where ground observations are frequently of interest. The median probabilistic L* is also given provided that at least 3 magnetic field models return an L* value. All returned L* are normalised by their respective constant dipole approximation for comparison of latitudes on the same scale. The Dst and Kp indices are also provided over the given time period. Shaded bars indicate times where observed values are on the nightside.
Please see the paper for full details:
Thompson, R. L., Morley, S. K., Watt, C. E. J., Bentley, S. N., & Williams, P. D. (2020). Pro‐L* ‐ A probabilistic L* mapping tool for ground observations. Space Weather, 18, e2020SW002602. https://doi.org/10.1029/2020SW002602