MIST
Magnetosphere, Ionosphere and Solar-Terrestrial
Average Ionospheric Electric Field Morphologies During Geomagnetic Storm Phases
By Maria-Theresia Walach (Lancaster University)
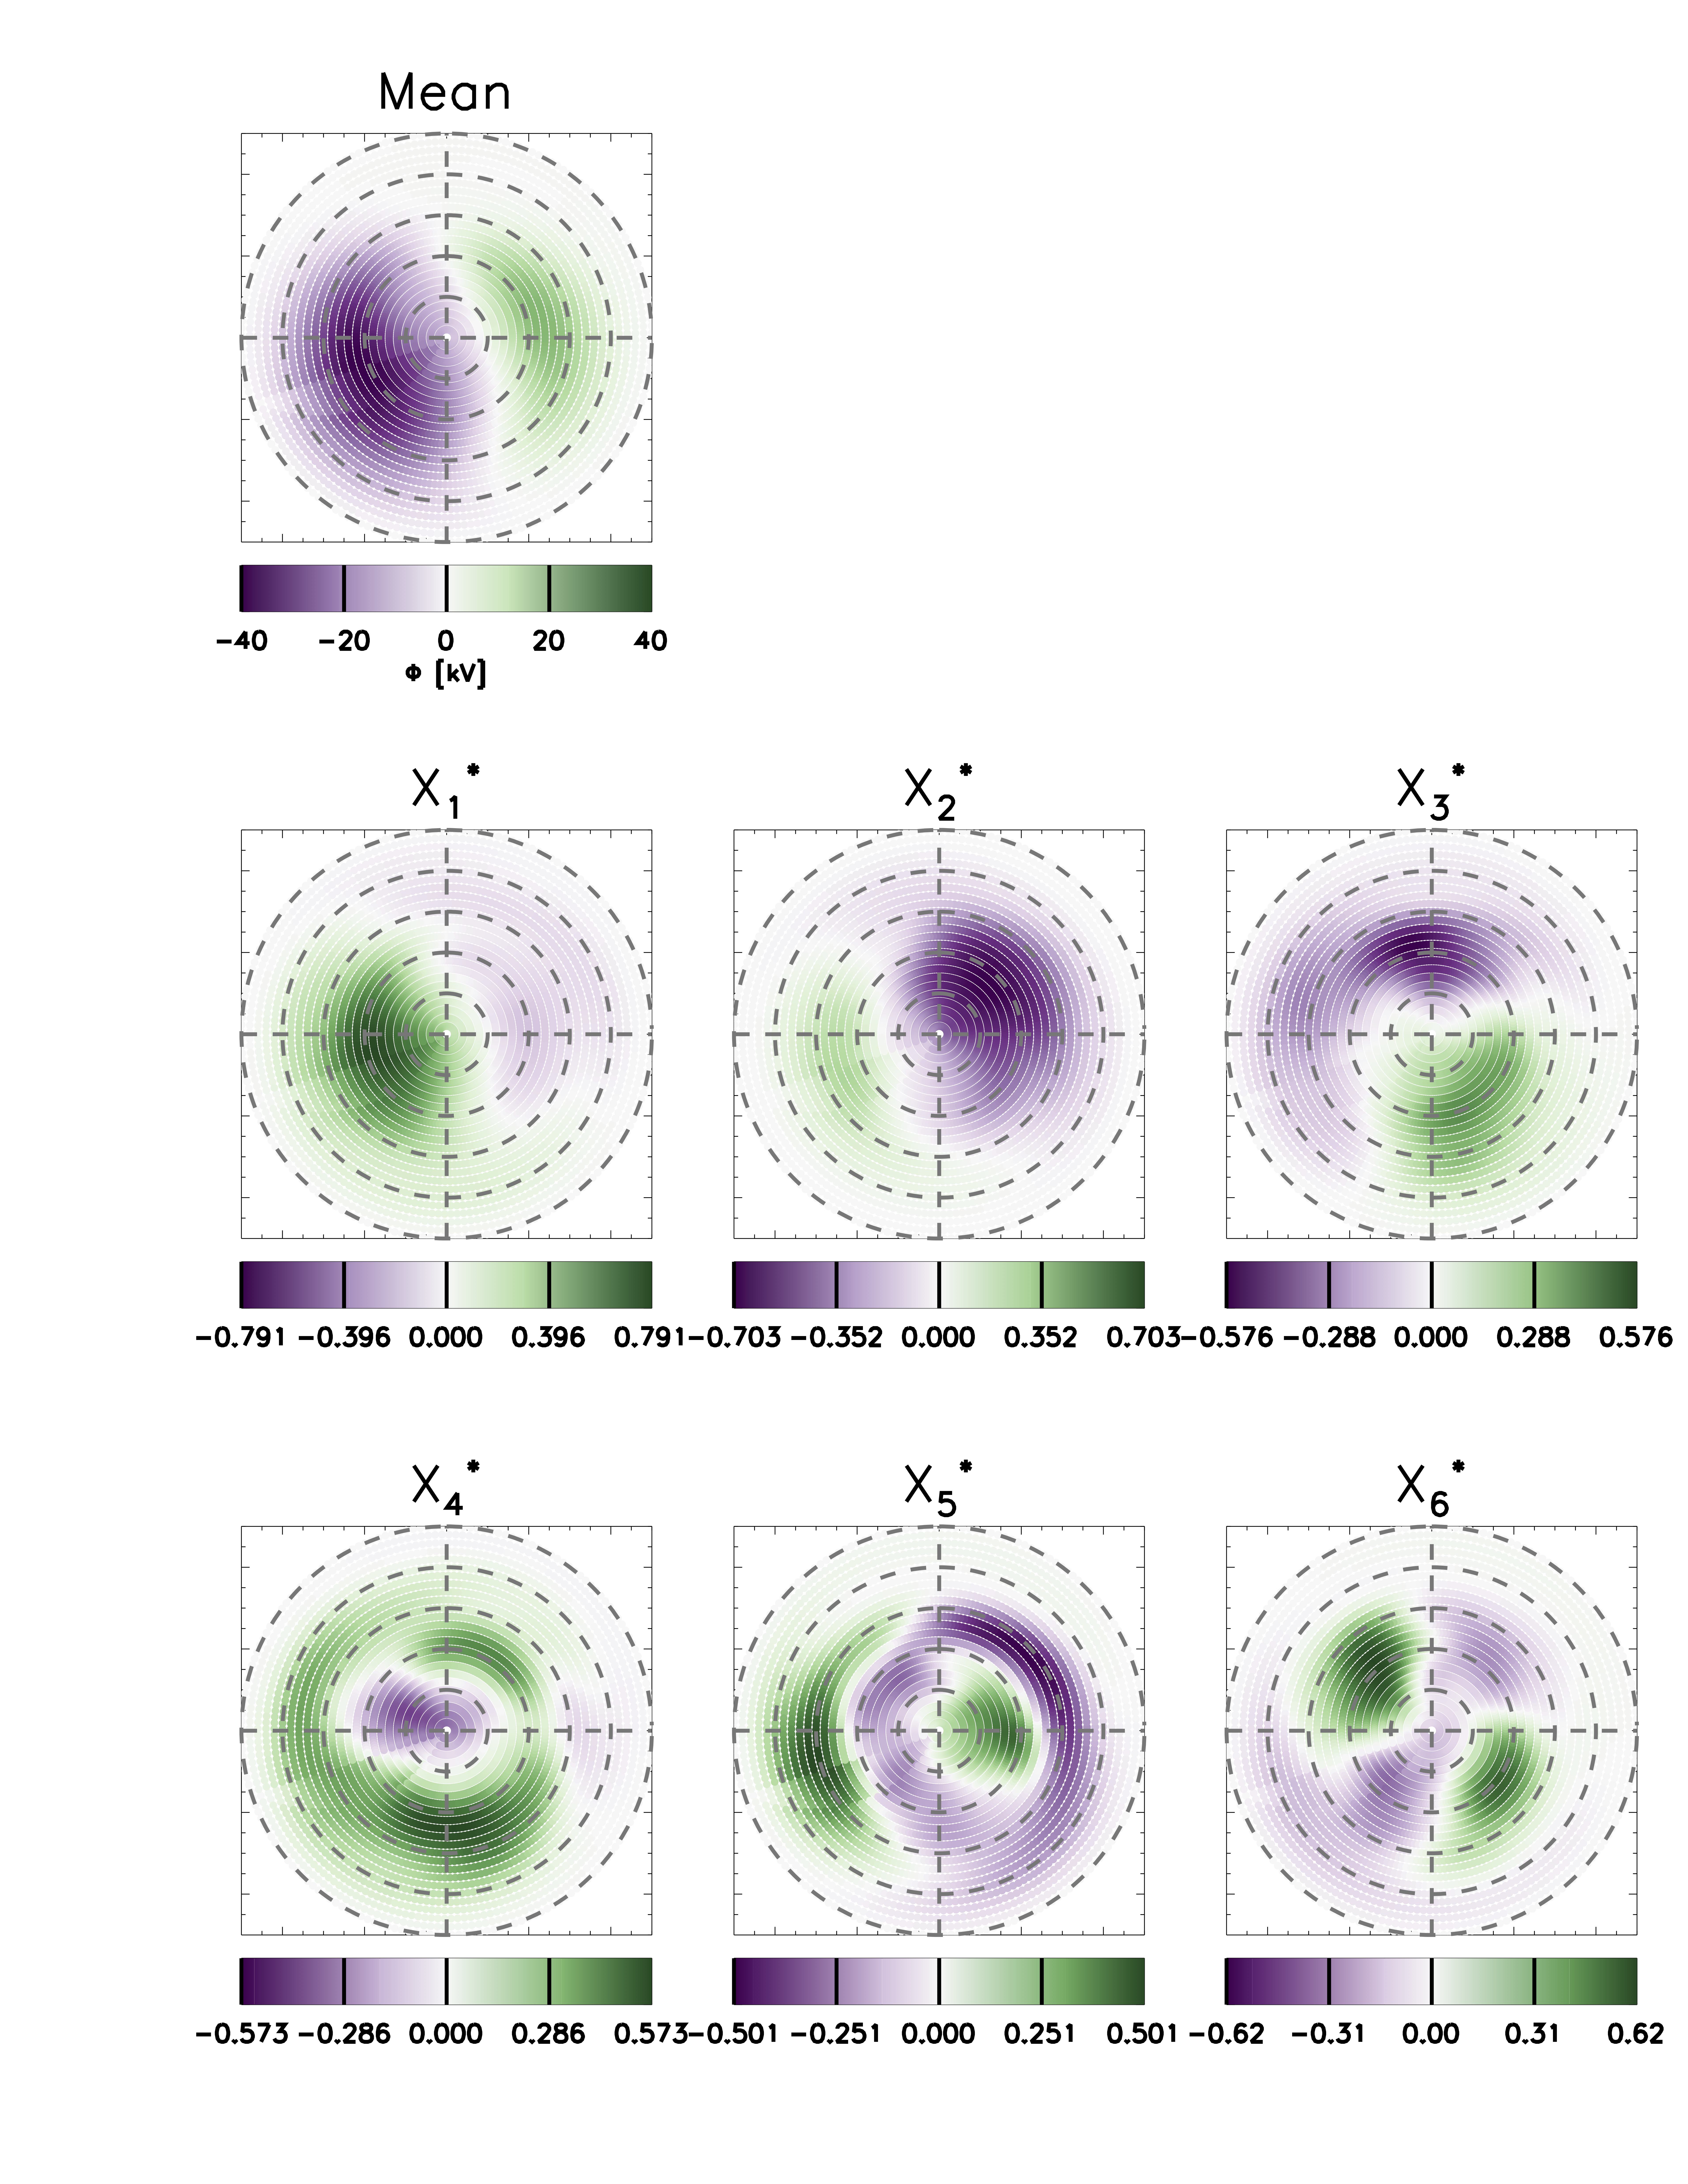
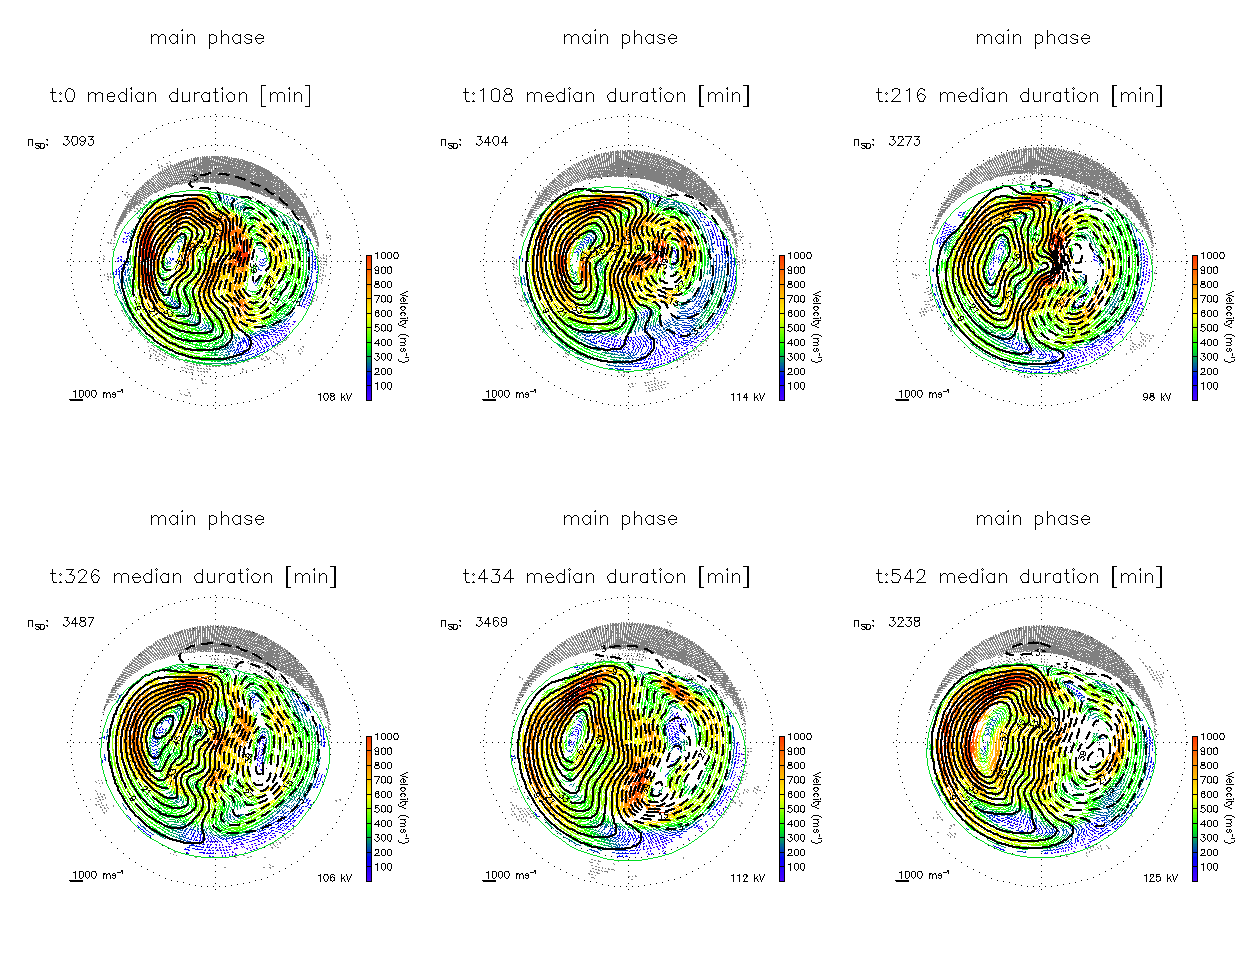
Geomagnetic storms are a global electrodynamic phenomenon, during which the ring current is loaded with energy. The coupled magnetospheric/ionospheric system responds during a geomagnetic storm and the dynamics of the system can be monitored using measurements of the high-latitude ionosphere. Ordering data from the Super Dual Auroral Radar Network (SuperDARN) by geomagnetic storm phase, we produce convection maps for a geomagnetic storm, which allow us to discern changes that occur in association with the development of the storm phases. We utilize principal component analysis to identify and quantify the primary electric potential morphologies during geomagnetic storms. Along with information on the size of the patterns, the first six eigenvectors provide over ∼80% of the variability in the morphology, providing us with a robust analysis tool to quantify the main changes in the patterns. Studying the first six eigenvectors and their eigenvalues shows that the primary changes in the morphologies with respect to storm phase are the convection potential enhancing and the dayside throat rotating from pointing toward the early afternoon sector to being more sunward aligned during the main phase of the storm. We find that the ionospheric electric potential increases through the main phase and then decreases once the recovery phase begins. Furthermore, we find that a two‐cell convection pattern is dominant throughout and that the dusk cell is overall stronger than the dawn cell.
The figure shows the mean electrostatic potential, followed by the first six eigenvectors. These show the most common components that can be used to make up the ionospheric convection patterns during geomagnetic storms.

Figure Caption: Ionospheric electric field component patterns showing the mean for geomagnetic storms (top left), followed by the patterns corresponding to the first six eigenvectors of the Principal Component Analysis. Each pattern is centered on the geomagnetic pole, with 12:00 magnetic local time pointing toward the top of the page, and dusk toward the left. Lines of geomagnetic latitudes are indicated from 40° to 90° by the dashed gray circles.

Animation Caption: Average convection patterns from SuperDARN data for geomagnetic storm main phase
Please see the paper for full details: Walach, M.‐T., Grocott, A., & Milan, S. E. (2021). Average ionospheric electric field morphologies during geomagnetic storm phases. Journal of Geophysical Research: Space Physics, 126, e2020JA028512. https://doi.org/10.1029/2020JA028512
