MIST
Magnetosphere, Ionosphere and Solar-Terrestrial
The Roles of the Magnetopause and Plasmapause in Storm-Time ULF Wave Power Enhancements
By Jasmine Kaur Sandhu (Northumbria University)
The Earth’s magnetosphere experiences extreme and dramatic changes during geomagnetic storms due to strongly enhanced solar wind conditions. One impact of the elevated solar wind conditions is the increased occurrence and amplitude of Ultra Low Frequency (ULF) waves across the dayside magnetosphere. These ULF waves are of particular interest due to their implications for transporting and coupling energy within the magnetosphere. However, the radial distribution of ULF wave power is complex – controlled interdependently by external solar wind driving and the internal magnetospheric structuring.
In this study, we explored how ULF wave power is distributed radially in the dayside magnetosphere. We conducted a statistical analysis of storm-time ULF wave power observations from the Van Allen Probes. The results showed that accounting for the plasmapause and (especially) the magnetopause locations reduce statistical variability and improve parameterisation of spatial trends over and above using the L value, highlighting the importance of these boundaries in controlling where and when enhanced ULF wave power is present.
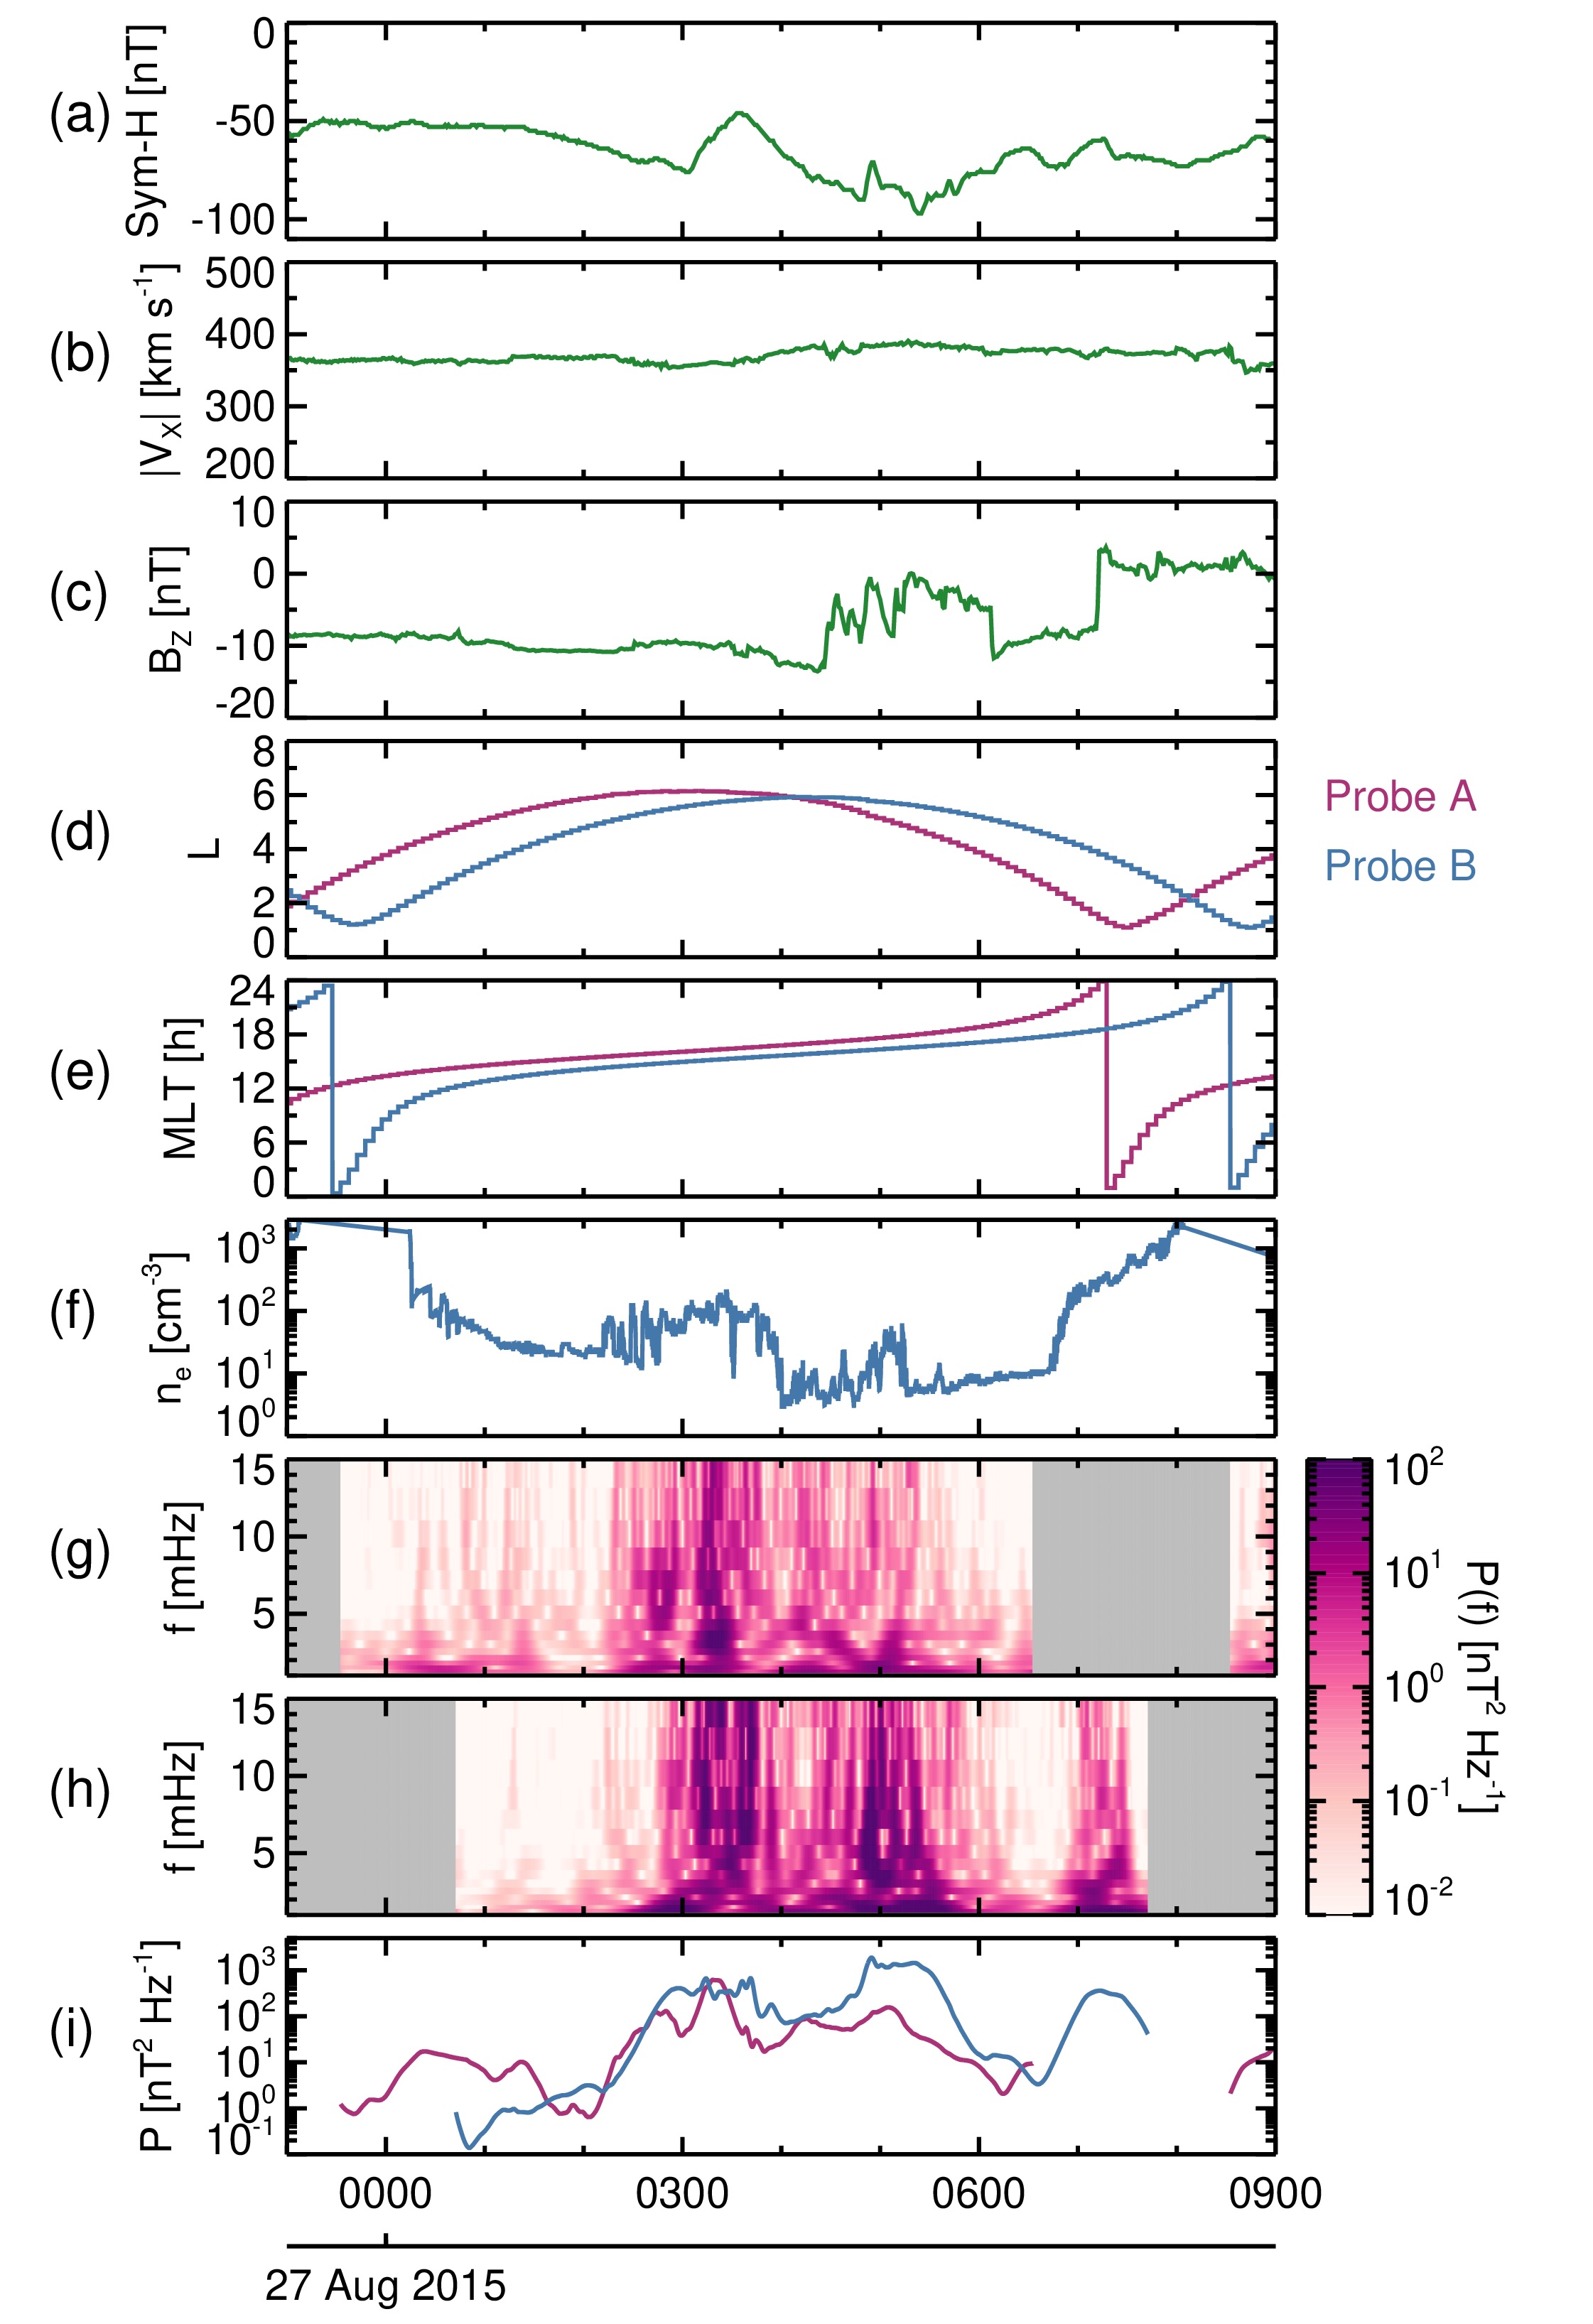
A key finding was the importance of local plasma density. We find that during geomagnetic storms, high density patches in the afternoon sector (e.g. plasmaspheric plumes) act to “trap” ULF waves, leading to spatially localised patches of very high ULF wave power. Figure 1 shows one example of high ULF wave power confined within a patch of enhanced density. The results have critical implications for understanding how ULF waves propagate within the terrestrial magnetosphere, and highlights the importance of the highly distorted storm-time cold plasma density distribution on wider geomagnetic processes.

Figure 1. Timeseries for 27 August 2015 showing the (a) Sym-H index [nT], (b) Earthward component of the solar wind speed, |vX| [km s-1], and (c) Southward IMF component, BZ [nT]. Panels (d-i) show time series for the Van Allen Probes A (pink) and B (blue). We show (d) L value and (e) MLT [h] of the spacecraft location, and (f) total electron density, ne [cm-3]. Panels (g) and (h) show power, P(f) [nT2 Hz-1], as a function of frequency, f [mHz], and time for Probe A and Probe B, respectively. Panel (i) shows the power, P [nT2 Hz-1], summed over the ULF wave band.
Please see the paper for full details:
, , , , , , & (2021). The Roles of the Magnetopause and Plasmapause in Storm-Time ULF Wave Power Enhancements. Journal of Geophysical Research: Space Physics, 126, e2021JA029337. https://doi.org/10.1029/2021JA029337
