MIST
Magnetosphere, Ionosphere and Solar-Terrestrial
Revealing the process behind the limitation of electron fluxes in the heart of the outer radiation belt
Suman Chakraborty (Northumbria University)
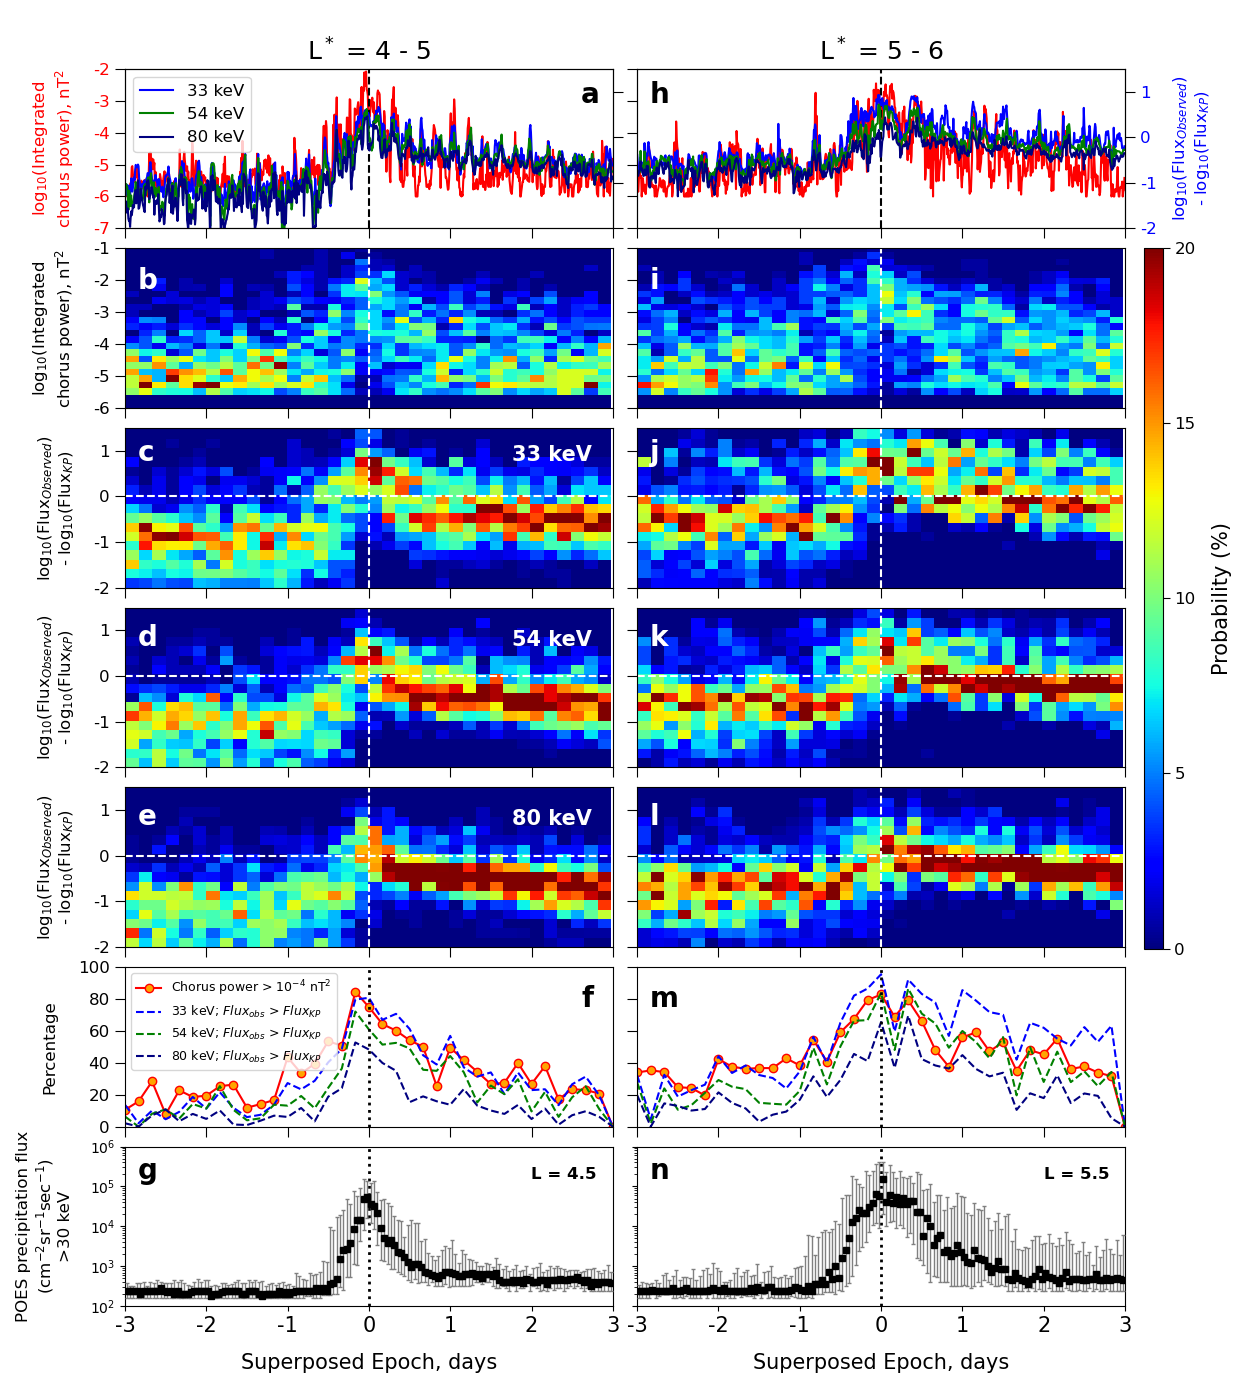
The dynamics of the Earth’s outer radiation belts is highly complex arising from a delicate competition between different physical processes including acceleration, transport, and loss. During periods of enhanced geomagnetic activities, the outer radiation belt electron fluxes may vary by several orders of magnitude which can result in severe spacecraft damage, and in some extreme cases, may even lead to spacecraft failure. Therefore, understanding the processes that are responsible for the observed radiation belt variability remains an active topic of research. In this paper (see below for details), we provide direct observational evidence of the process that results in the limitation of outer radiation belt electron fluxes during geomagnetic storms. To conduct this study, we used electromagnetic wave and electron flux measurements from the Van Allen Probes during 70 isolated geomagnetic storms spanning the entire mission (2012 – 2019). We found that during the main phase of geomagnetic storms, when the flux of tens of keV electrons reaches close to or exceeds a theoretically predicted limiting flux value, intense chorus waves are generated having wave power 2 – 3 orders of magnitude larger than the pre-storm level. These intense chorus waves (wave power > 10-4 nT2, a value chosen from the superposed epoch response of the storms) rapidly scatter electrons into the loss cone causing atmospheric precipitation, thereby maintaining the fluxes at a value close to the limit predicted by Kennel and Petschek more than 50 years ago (see Figure 1). This study provides a significant advance in our understanding of the radiation belt variability as it shows that the electron fluxes cannot grow uncontrollably during geomagnetic storms, instead, they are capped through a chorus wave-driven flux-limitation process that is independent of the acceleration mechanism or source responsible for the flux enhancement.

Figure 1: Median (a, h) integrated chorus wave power (nT2; red) and difference of observed and calculated KP limiting flux for 33 keV (blue), 54 keV (green), and 80 keV (navy) electrons; probability distribution function (PDF) of (b, i) integrated chorus wave power and difference of observed and KP limiting flux for (c, j) 33 keV, (d, k) 54 keV and (e, l) 80 keV electrons in logarithmic scale; (f, m) percentage of finding integrated chorus wave power> 10−4 nT2 and observed flux greater than KP limiting flux for 33 keV (blue), 54 keV (green) and 80 keV (navy) electrons within the L∗ range 4–5 (left panel) and 5–6 (right panel); and precipitating flux as observed by POES for > 30 keV electrons at (g) L = 4.5 and (n) L = 5.5 as a function of superposed epoch (in days) between 0 − 12 MLT. In each panel, the vertical dashed line marks the zero epoch, and the horizontal dashed lines in panels (c–e) and (j–l) indicate the observed flux being equal to the KP limiting flux. The colorbar at the right denotes the PDF so that the probability of finding events in each vertical slice adds up to 100%. In panels (g, n), the black scatter plot shows median electron flux and the error bars represent upper and lower quarterlies of the superposed epoch statistics.
Reference: Chakraborty, S., Mann, I.R., Watt, C.E.J., Rae, I.J., Olifer, L., Ozeke, L.G., Sandhu, J.K., Mauk, B.H., and Spence, H. Intense chorus waves are the cause of flux-limiting in the heart of the outer radiation belt. Sci Rep 12, 21717 (2022).https://doi.org/10.1038/s41598-022-26189-9.
