MIST
Magnetosphere, Ionosphere and Solar-Terrestrial
Latest articles
- Introducing XIM to Study the Spectral Properties of Solar Wind Charge Exchange at Earth’s Magnetospheric Boundaries
- Saturn's Auroral Dusk Sector Magnetosphere-Ionosphere Coupling During Cassini's Proximal Orbits
- A Multi-Event Comparison of dB/dt Resulting From Omega Band Aurora
- Can we Resolve Magnetosheath Jets with a Soft X-ray Imager?
- Russell-McPherron mechanism effect on space junk de-orbiting
Latest news
2026 MIST Council Election Results
It is our pleasure to announce the results of the latest MIST Council Election.
- Samuel Wharton (University of Leicester) is elected for a 3 year term as a MIST Councillor
- Jewel Abbey Relampagos (Lancaster University) is elected for a 1 year term as the MIST Student Representative
In addition, due to concerns from the community regarding the ongoing UKRI/STFC funding situation, MIST Council have also decided to charter Mark Lester (University of Leicester) as an additional councillor to inform and steer the council in matters related to this specific brief, as set out in Article 4.5 of the MIST Charter.
We would like to congratulate everyone on their new roles. The full composition of Council can be found on the MIST website (https://www.mist.ac.uk/community/mist-council). We would like to thank all the candidates for putting themselves forward and everyone who took part in the voting. We received votes from 132 people which represents a turnout of 21.5% of people registered to receive the MIST emailing list.
Finally, MIST Council would like to extend their thanks and gratitude to our outgoing members: Fiona Ball and Georgios Nicolaou. We would also like to say a special thank you to Andy Smith who was co-opted to be on MIST council while Rosie Johnson was on maternity leave, thank you for all of your hard work.
Open Letter Ready For Signatories
Protect MIST Science! Sign the MIST Community Open Letter on the STFC funding cuts!
https://sites.google.com/view/uk-mist-community-open-letter
Statement from MIST Council regarding the STFC Funding Situation
Statement from MIST Council regarding the STFC Funding Situation
MIST Council is deeply concerned by the ongoing STFC funding uncertainty and its impact on our community and beyond.
The current combination of prospective delayed and reduced funding, together with already volatile financial situations at universities across the UK, is placing significant strain on research groups. In some cases, institutions may be unable to support researchers through gaps between projects, increasing precarity across the community and adding significant pressure on early-career researchers.
We are concerned that continued uncertainty risks accelerating a brain drain from the UK, as skilled researchers reconsider their future in a system offering limited stability. The loss of expertise at any career stage would have lasting consequences for UK space science.
What is going on?
For those that are unaware of the situation, it is complex and evolving. We suggest the following sources to get up to speed on the current developments.
https://ras.ac.uk/news-and-press/news/proposed-budget-cuts-catastrophe-uk-astronomy
What are we doing about it?
Behind the scenes, MIST Council is actively engaging with relevant parties to understand the scale of the challenge and to identify constructive ways forward.
- We are seeking seasoned members of the community to join MIST Council on a task force to help develop options and represent the needs of our community. If you would like to be involved, please reach out to us via the MIST Council email (This email address is being protected from spambots. You need JavaScript enabled to view it.) by the end of this week (13th February 2026).
- In addition to the task force, we want to provide an open forum for discussion and collective input among all members of the wider MIST community. We are exploring options and will be in touch as soon as possible with further details.
- We believe in working together in the face of the current challenges and we are collaborating with UKSP and others to strive for a fair and positive outcome for all. We are reaching out to members of the SSAP (Solar System Advisory Panel) to explore the hosting of a community town hall meeting, like the one already being organised by the AAP (Astronomy Advisory Panel), to provide an open forum for discussion and collective input.
What can you do to help?
There are several open letters representing people in various career stages that have been made available to sign. We encourage you to read the relevant letter(s) and to sign them if you support them:
- Fellowship Holders: https://advancedfellows-openletter-stfc.github.io/index.html
- Early Career Researchers: https://ecr-openletter-stfc.github.io/
The Royal Astronomical Society are also urging Fellows to lobby their MPs against the cuts, and have included a template letter that can be used to do so:
https://ras.ac.uk/news-and-press/news/ras-fellows-urged-lobby-against-unprecedented-cuts
MIST Council will continue to advocate for transparency, stability, and funding structures that recognise both the long-term nature of our science and the people who deliver it.
We thank you for your continued support in this period of uncertainty.
Please contact This email address is being protected from spambots. You need JavaScript enabled to view it. if you have further suggestions.
MIST Council

Announcement of New MIST Council 2025
We are very pleased to announce the following members of the community have been elected to MIST Council:
- Gemma Bower (University of Leicester), MIST Councillor
- Tom Elsden (University of St Andrews), MIST Councillor
- Cameron Patterson (Lancaster University), MIST Councillor
- Fiona Ball (University of Southampton), Student Representative
They will begin their terms in July 2025.
We thank outgoing MIST Council members: Maria Walach, Chiara Lazzeri and Emma Woodfield. Andy Smith will remain on council a little longer as a co-opted member to cover Rosie Johnson's maternity leave.
The current composition of Council can be found on our website (https://www.mist.ac.uk/community/mist-council).
Announcement of New MIST Councillors.
We are very pleased to announce the following members of the community have been elected unopposed to MIST Council:
- Rosie Johnson (Aberystwyth University), MIST Councillor
- Matthew Brown (University of Birmingham), MIST Councillor
- Chiara Lazzeri (MSSL, UCL), Student Representative
Rosie, Matthew, and Chiara will begin their terms in July. This will coincide with Jasmine Kaur Sandhu, Beatriz Sanchez-Cano, and Sophie Maguire outgoing as Councillors.
The current composition of Council can be found on our website, and this will be amended in July to reflect this announcement (https://www.mist.ac.uk/community/mist-council).
Saturn's Auroral Dusk Sector Magnetosphere-Ionosphere Coupling During Cassini's Proximal Orbits
By Sam Farr (Lancaster University)
In 2017, Cassini executed its final twenty-two low-altitude passes over the auroral regions of Saturn. This enabled the determination of Saturn's field-aligned currents (FACs) from magnetometer measurements at lower altitudes than previously achieved. We investigate southern dusk-side FAC behaviour with four objectives: how in situ MAG measurements compare to the highly variable auroral oval previously imaged, what the typical behaviour of the FACs is, the degree of influence Saturn's unique PPO FAC systems have in this region, and how these regions' FACs respond to the solar wind.
We found that this region consists of a mix of thin, filamented, field-aligned currents flowing upward or downward. A preference toward upward FACs near the poleward edge of our data set was observed, with those upward FACs showing greater magnitudes than downward ones at similar latitudes. The PPO systems drive periodic auroral emission and fluctuations in the magnetic field. We modelled their expected contributions and found that they aren't major drivers of filamented FAC behaviour at dusk, but do influence broader structures. During periods when the solar wind compresses Saturn's magnetic field, the FAC structure initially exhibits stronger, broader filaments. After two Saturn rotations beyond compression onset, these enhanced filaments are no longer observed. We see evidence of a broad increase in upward-directed FACs across the auroral region during these compressions, and of PPO-driven shifting of the auroral oval.
See publication for more details:
https://agupubs.onlinelibrary.wiley.com/doi/10.1029/2026JA035533
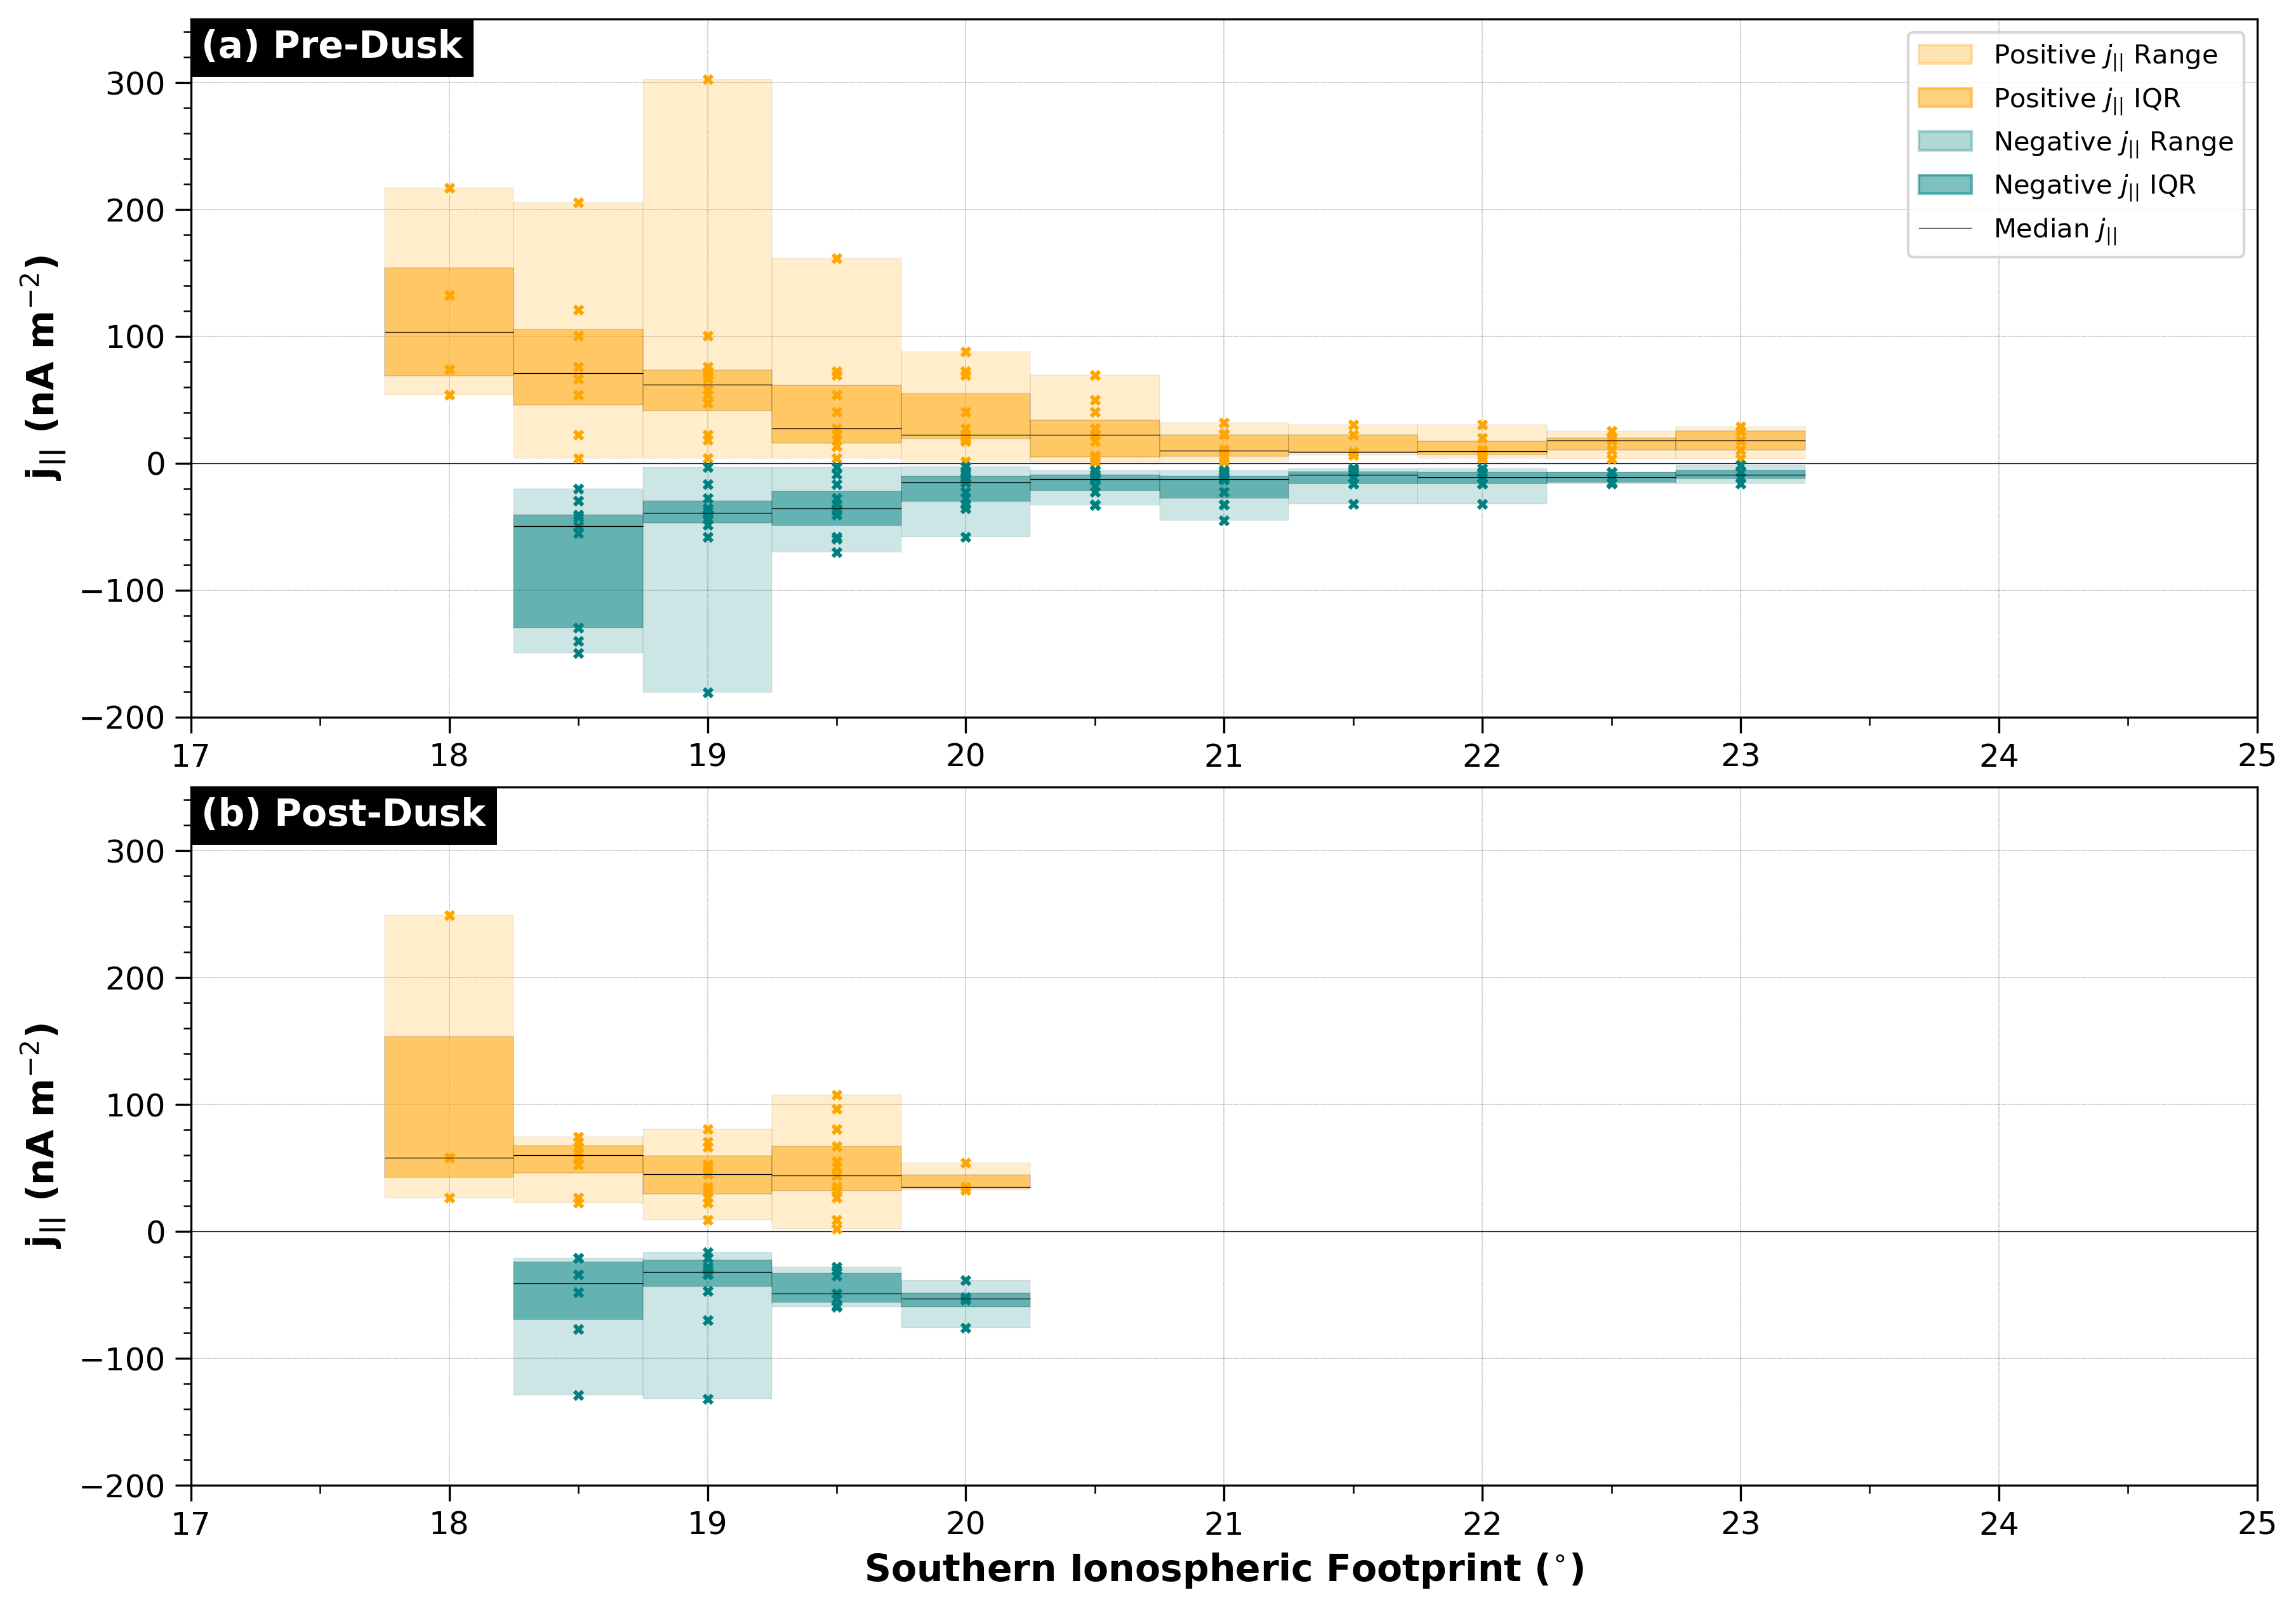
Distribution of current sheet density magnitude versus footprint colatitude for two regions roughly corresponding to pre-dusk (16-19LT) and post-dusk (19-22LT). A smoothing algorithm was applied to determine FAC boundaries, and current sheet density was determined at set colatitude points. This process was repeated for all orbits. Panel (a) combines upwards and downwards field-aligned currents in the pre-dusk sector in orange and teal, respectively. Panel (b) is the same for post-dusk. The horizontal black lines in each bin show the median values for the positive and negative distributions independently; the darker-coloured shaded region shows the interquartile range; and the light-coloured shaded region shows the full range. Small crosses show individual datapoints.