MIST
Magnetosphere, Ionosphere and Solar-Terrestrial
Plasma Heating From Dipolarizations in Saturn's Magnetotail
By Andrew Smith, Department of Physics and Astronomy, University of Southampton, UK.
Magnetic reconnection in a planet's magnetotail allows the stretched field to snap back towards the planet, carrying with it a bundle of plasma. This is known as a dipolarization front, which often manifest in spacecraft data as rapid rotations of the magnetic field accompanied by a change in the local plasma character. Dipolarization fronts have been observed at Earth, Mercury, Jupiter and Saturn and are thought to be linked to bright auroral displays.
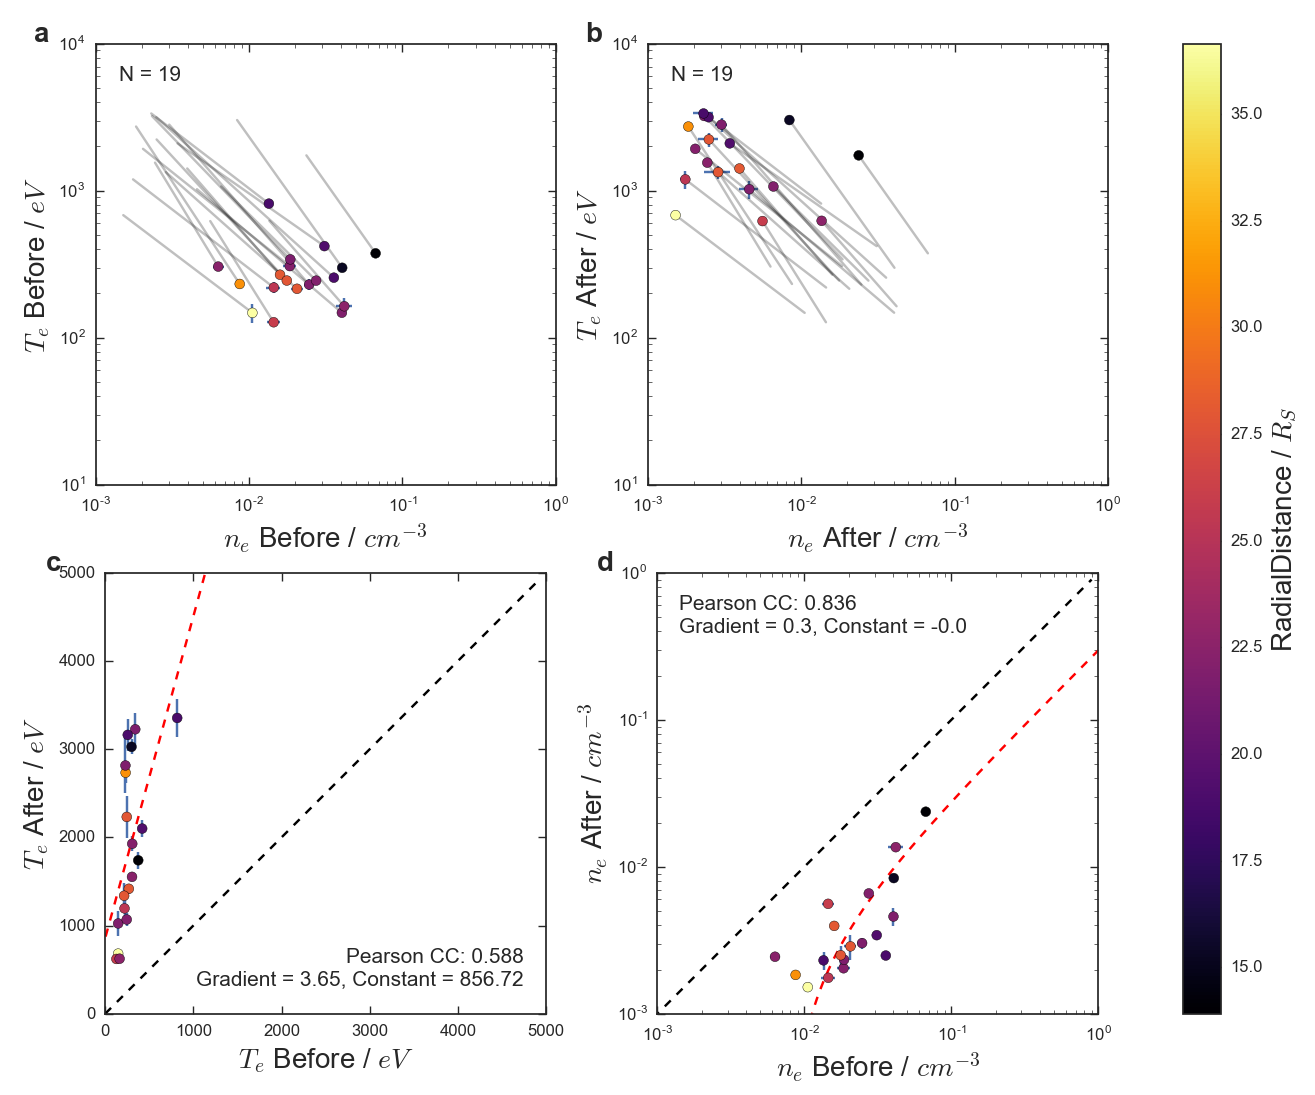
We performed a large automated survey of Cassini data, identifying 28 intervals when the spacecraft was in the path of dipolarization fronts sweeping towards Saturn. The changes in plasma properties were investigated, along with the supra-thermal composition. A large dawn-dusk asymmetry was present in the observations, with 79% of the events located post-midnight. Figure 1 shows the change in plasma characteristics from that preceding the front (a) to within the dipolarizing material (b). All of the identified events showed an increase in the electron temperature and a coupled reduction in the electron density. Figures 1c and (d) show the relative change in temperature and density respectively. Overall, the temperature was found to increase by factors between 4 and 12, while the density dropped by factors of 3-10. The variable plasma properties are thought to be linked to a variable reconnection location, particularly post-midnight.

Figure 1: Panels (a) and (b) show the electron density plotted aainst the electron temperature for before (a) and after (b) the dipolarization front. These panels are plotted on the same axes scale for direct comparison. The gray lines indicate how the events move in density-temperature space. Panels (c) and (d) show the electron temperature and density (respectively) before the front plotted against the electron temperature and density after the passage of the front. The points and error bars provided are the mean and standard error of the mean respectively. The diagonal black dashed line shows the location of $y = x$: where the points would lie if there was no change following the passage of the front. The red dashed lines indicate least squares linear fits to the data; the details of the fit parameters are provided on the panels. The color bar for all four panels indicates the radial distance at which the spacecraft encountered the event.
For more information, see the paper below:
Smith, A. W., Jackman, C. M., Thomsen, M. F., Sergis, N., Mitchell, D. G., & Roussos, E. (2018). Dipolarization fronts with associated energized electrons in Saturn's magnetotail. Journal of Geophysical Research: Space Physics, 123, 2714–2735. https://doi.org/10.1002/2017JA024904