MIST
Magnetosphere, Ionosphere and Solar-Terrestrial
Which Kelvin-Helmholtz waves grow along the spatially-varying magnetopause flanks and why?
Which Kelvin-Helmholtz waves grow along the spatially-varying magnetopause flanks and why?
By Harley Kelly (Imperial College London)
The Kelvin-Helmholtz instability mediates the viscous-like solar-terrestrial interaction, allowing solar wind plasma and energy to penetrate our magnetic shield through generating magnetopause surface waves that quickly become non-linear. Determining when and where this should occur and which wave modes grow has remained challenging. This is because the underlying theory has concentrated on local wave growth, where the locally most-unstable linear wave dominates. However, these waves travel along the boundary into new regions where the instability is still able to amplify these perturbations despite the different background properties. Two possible paradigms exist, waves are either:
(a) locally generated, being those predicted by the simple theory
(b) originate further upstream, having travelled and grown along the way
We address this conundrum by applying a machine learning technique, Dynamic Mode Decomposition, that efficiently extracts distinct wave modes from a simulation of the entire magnetosphere. This shows Kelvin-Helmholtz waves do grow quickly out of some points on the boundary, signaling local generation. However, their energy persists as they travel down the tail, slowly growing in both amplitude and spatial extent in the process due to the accelerating flow around the magnetosphere and its effect on the instability. Therefore, both effects play a role in which waves are dominant at any point.
These results may explain why longer wavelengths are observed in the tail than local theory predicts and motivates further exploration of tangential inhomogeneities in basic Kelvin-Helmholtz theory. We also highlight that Dynamic Mode Decomposition may prove a powerful technique for studying other forms of waves, instabilities and turbulence across the heliosphere.
See publication for more details:
Kelly, H. M., Archer, M. O., Eastwood, J. P., Heyns, M., Eggington, J. W. B. and Chittenden, J. P (2026). Superposition of Doppler-Shifting Magnetopause Kelvin-Helmholtz Modes Through Dynamic Mode Decomposition of a Global MHD Simulation. Geophysical Research Letters, 53, e2025GL120284, https://doi.org/10.1029/2025GL120284
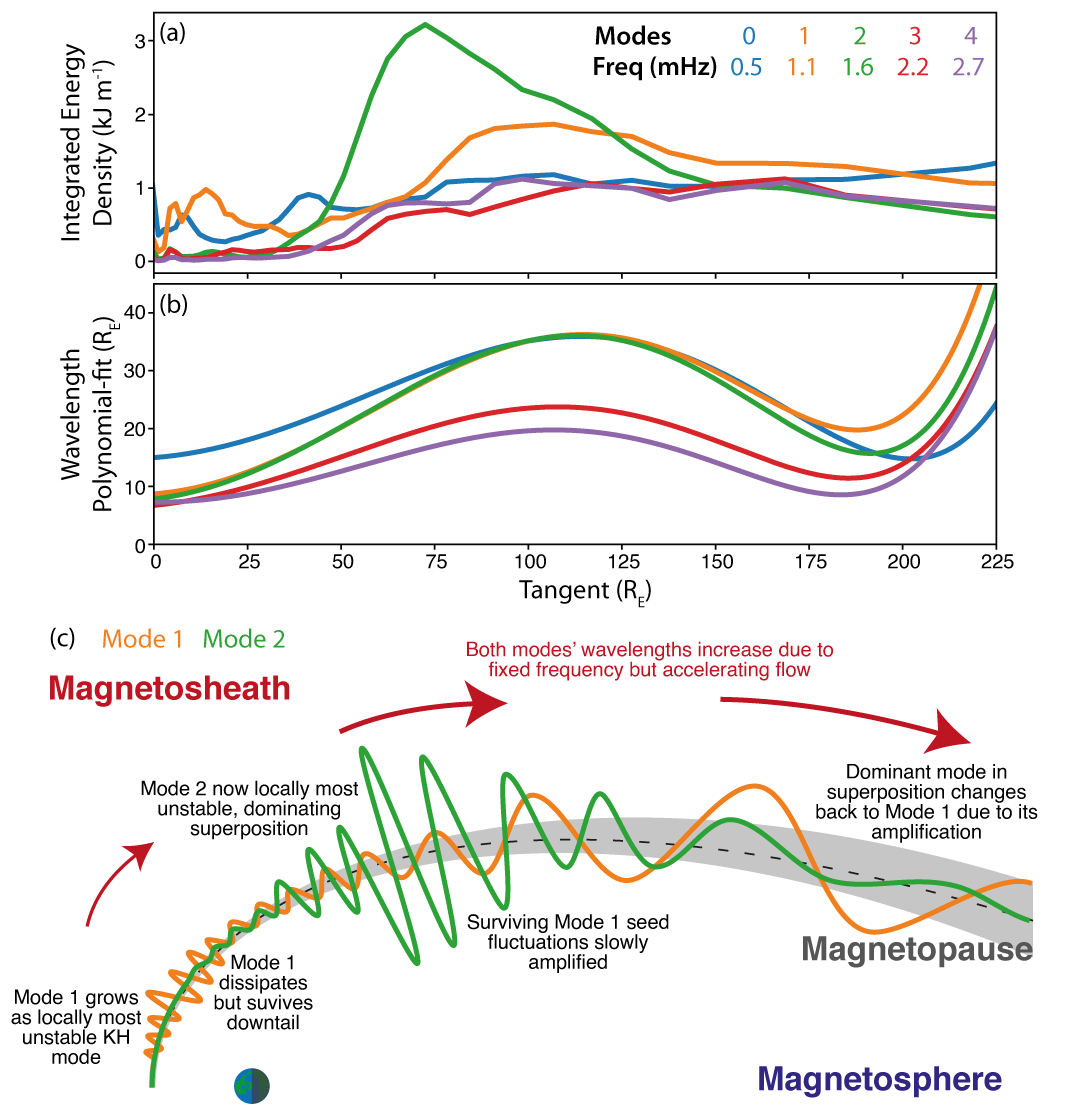
Comparison of dynamic mode decomposition modes along equatorial magnetopause tangent showing (a) integrated energy densities and (b) polynomial-fit wavelengths. (c) Cartoon depicting key results.
A new declining phase precursor and an early prediction of cycle 26 maximum
A new declining phase precursor and an early prediction of cycle 26 maximum
By Sandra Chapman (CFSA, Physics, University of Warwick)
The solar polar magnetic fields during the declining phase of each Schwabe solar cycle 'seed' the toroidal fields that drive sunspot activity of the next cycle. This paper identifies the specific phase of the cycle, and hence the timing, where this relationship should unambiguously be seen, both in models and in high resolution observations. This is central to comparing observations with solar dynamo models as well as providing a precursor method to forecast the upcoming cycle maximum.
The Hilbert transform of 13 month smoothed sunspot number (SSN) since 1749 is used to construct a uniform clock for the Schwabe solar cycle which establishes a clear switch-on and off of geomagnetic activity seen at earth [1] and which correlates with solar morphology on solar cycle scales [2]. By mapping the irregular solar cycle onto a regular clock, the timings of a clear switch-off of activity in the cycle declining phase have been found. The switch-off is when solar eruptions change in character from coronal mass ejections to high speed streams, correlating both with the sunspot active regions moving to lower solar latitudes with reduced differential rotation, and the switch-off of extreme space weather at earth. The SSN at the switch-off is found to correlate well with the following SSN maximum, providing a method for predicting the upcoming cycle maximum on a ~7 year time horizon [3].
[1] S. C. Chapman, S. W. McIntosh, R. J. Leamon, N. W. Watkins, Quantifying the solar cycle modulation of extreme space weather, Geophysical Research Letters, (2020) doi:10.1029/2020GL087795
[2] S. C. Chapman, T. Dudok de Wit, A solar cycle clock for extreme space weather. Sci Rep 14, 8249 (2024). doi:10.1038/s41598-024-58960-5
[3] S. C. Chapman, A new declining phase precursor and an early prediction of cycle 26 maximum, Ap. J. in press (2026) doi:10.3847/1538-4357/ae6859
See publication for more details:
S. C. Chapman, A new declining phase precursor and an early prediction of cycle 26 maximum, Ap. J. in press (2026) doi:10.3847/1538-4357/ae6859
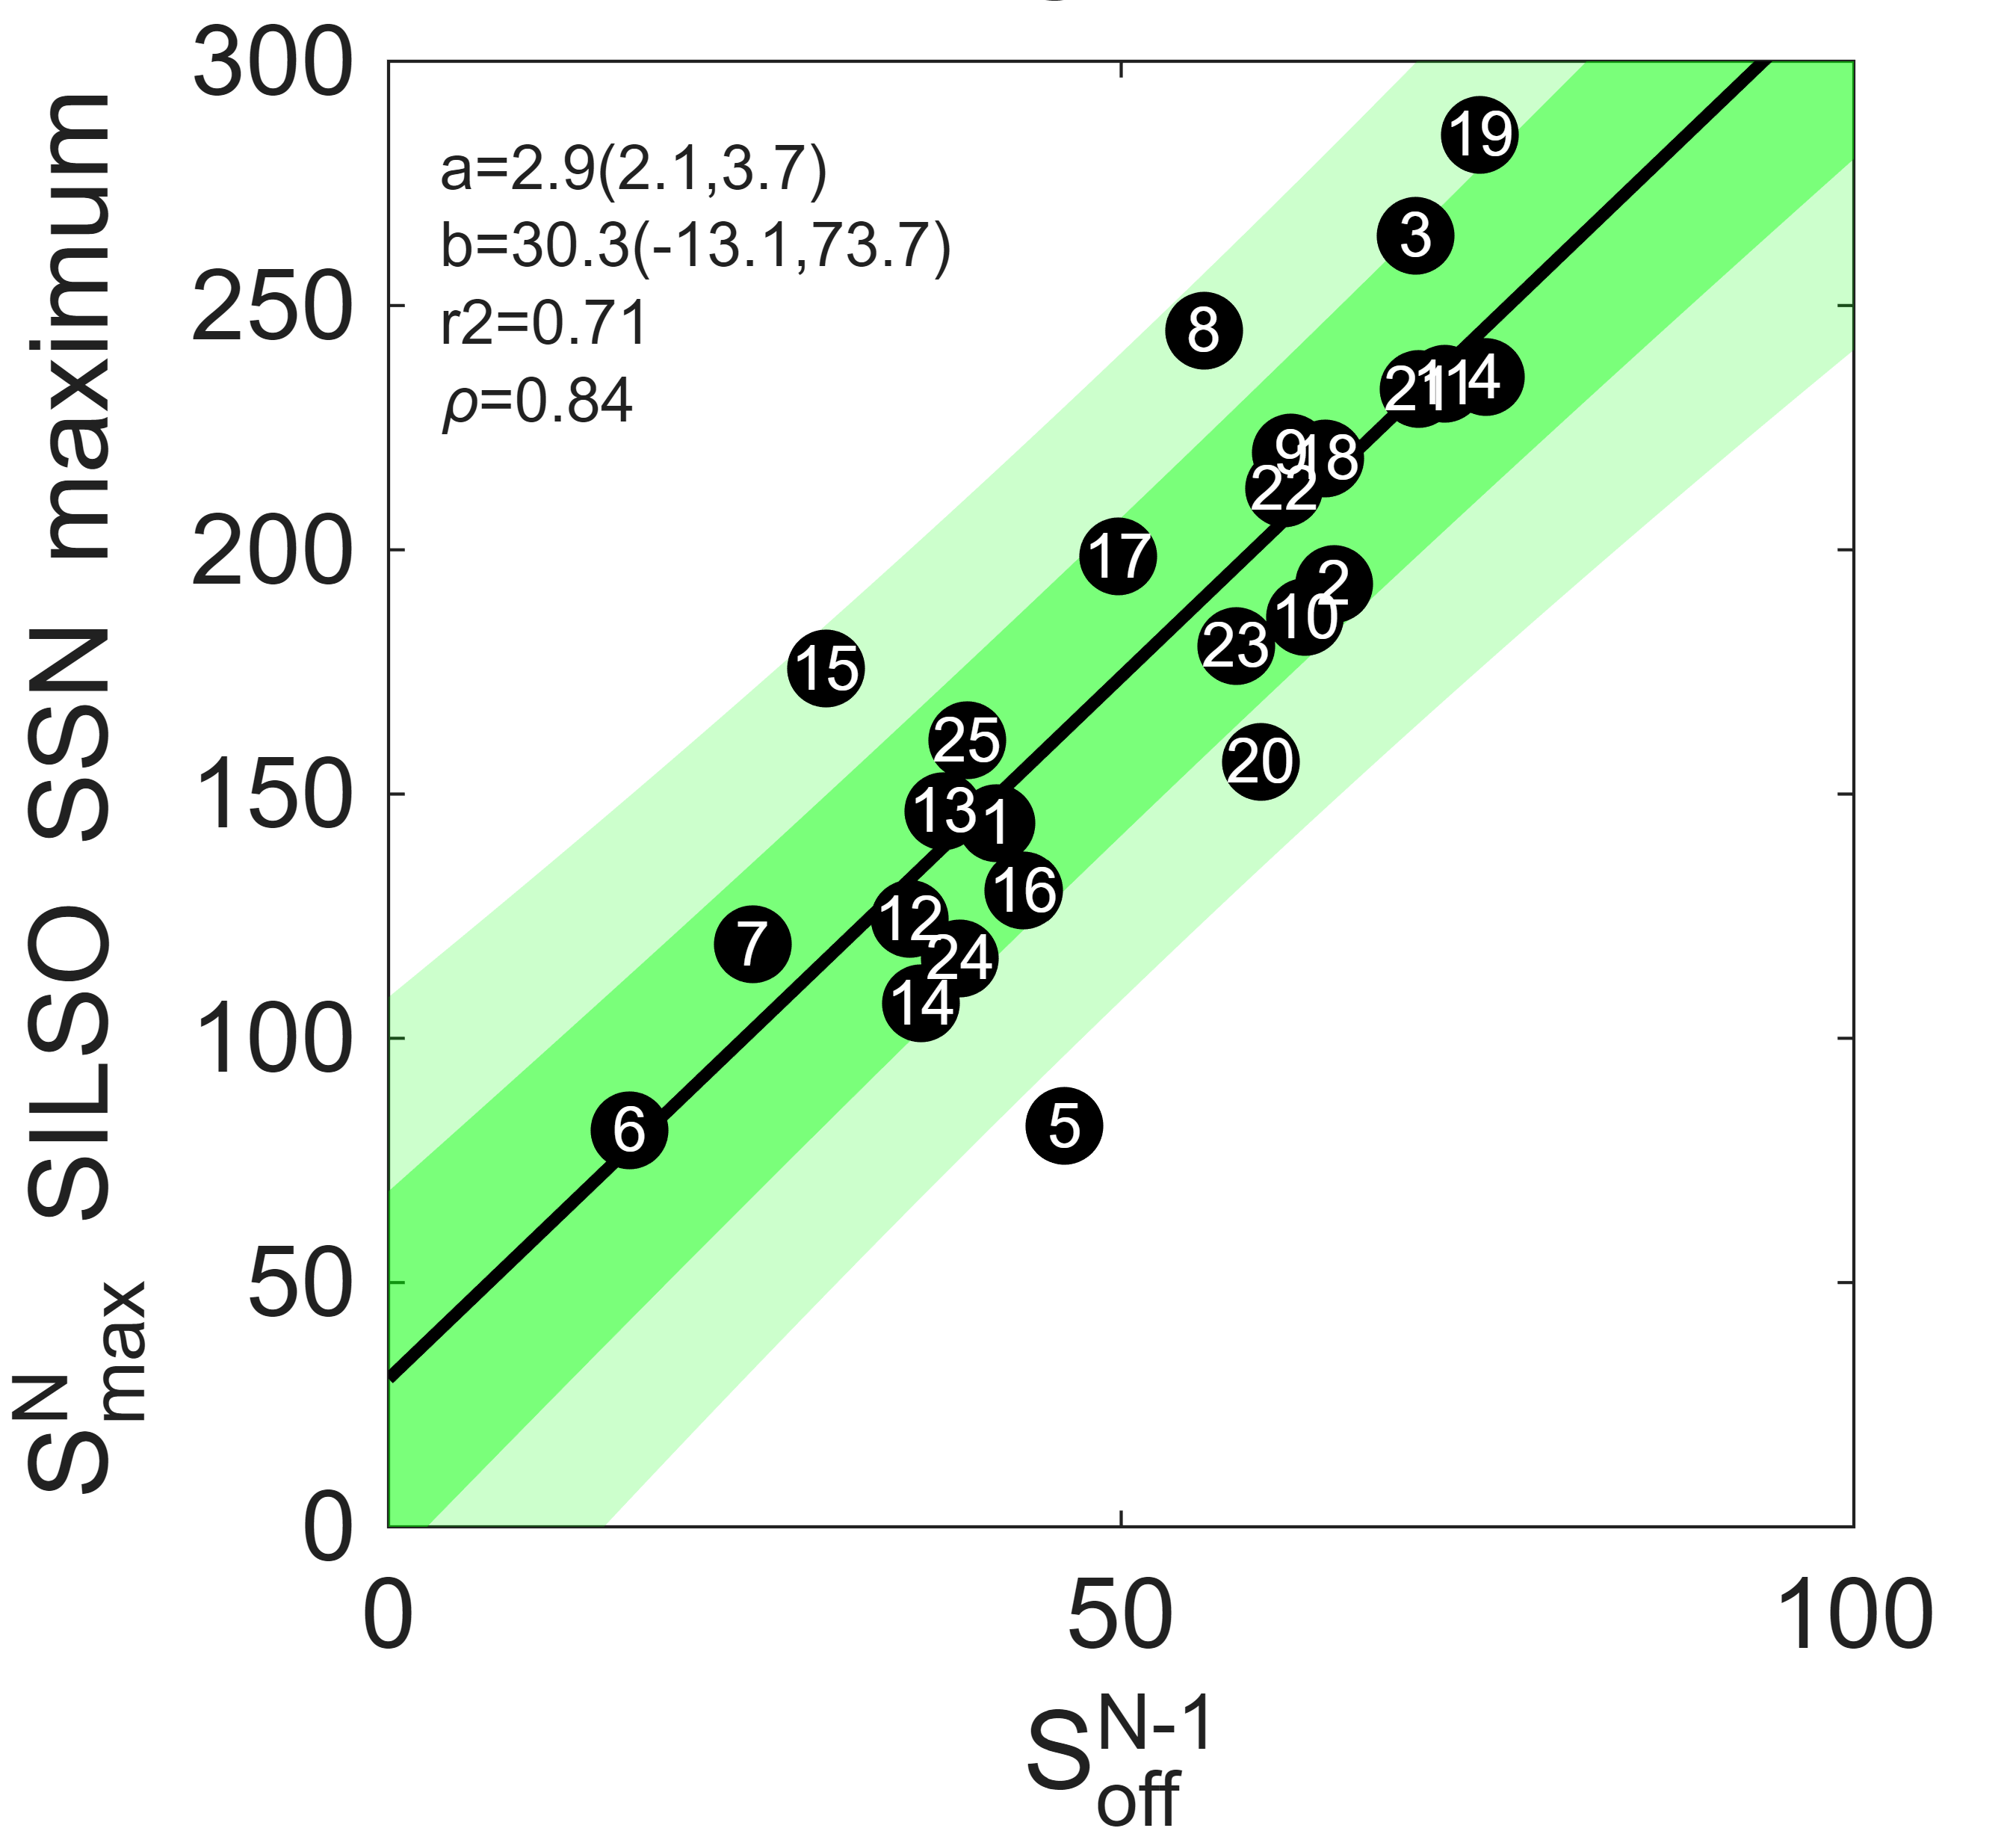
Correlation of the solar maximum sunspot number (SSN) with preceding solar cycle declining phase. Linear regression (black lines) with 68% and 95% confidence bounds (dark and light green shading) of each SSN solar maximum from SILSO plotted versus preceding cycle SSN at switch-off. Black circles indicate each cycle.
Short-Term Variability of Jupiter's Satellite Footprints as Spotted by JWST
Short-Term Variability of Jupiter's Satellite Footprints as Spotted by JWST
By Katie Knowles (Northumbria University)
The James Webb Space Telescope (JWST) conducted a clockwise scan around the entire limb of Jupiter, chasing the northern lights, or aurora, as they rotated into view. This dynamic phenomenon is a result of charged particles traveling down magnetic field lines, crashing into the top of the atmosphere, or ionosphere, and causing it to glow. During its scan, JWST captured an extraordinary aspect of Jupiter's aurora, known as the auroral footprints, which are bright emission patterns produced as a result of the interaction between Jupiter's Galilean moons and the space environment surrounding the planet. Here, we present the first measurements of the physical properties of the auroral footprints of Jupiter's two innermost Galilean moons, Io and Europa, including the local temperature and ionospheric density, in the near-infrared. A never-seen-before low temperature structure was discovered, centred on Io's bright spot of emission, possessing extremely high densities. This is likely driven by extreme changes in the flow of electrons crashing into the upper atmosphere. Our analysis, as well as further endeavours, can supply context to in-situ measurements acquired by NASA's Juno spacecraft as it traversed within the moons' orbits, as well as for future investigations of the Galilean satellites, including the Jupiter Icy Moons Explorer (Juice) and Europa Clipper.
See publication for more details:
Knowles, K. L., Melin, H., Stallard, T. S., Moore, L., O’Donoghue, J., Schmidt, C., et al. (2026). Short-term variability of Jupiter's satellite footprints as spotted by JWST. Geophysical Research Letters, 53, e2025GL118553. https://doi.org/10.1029/2025GL118553
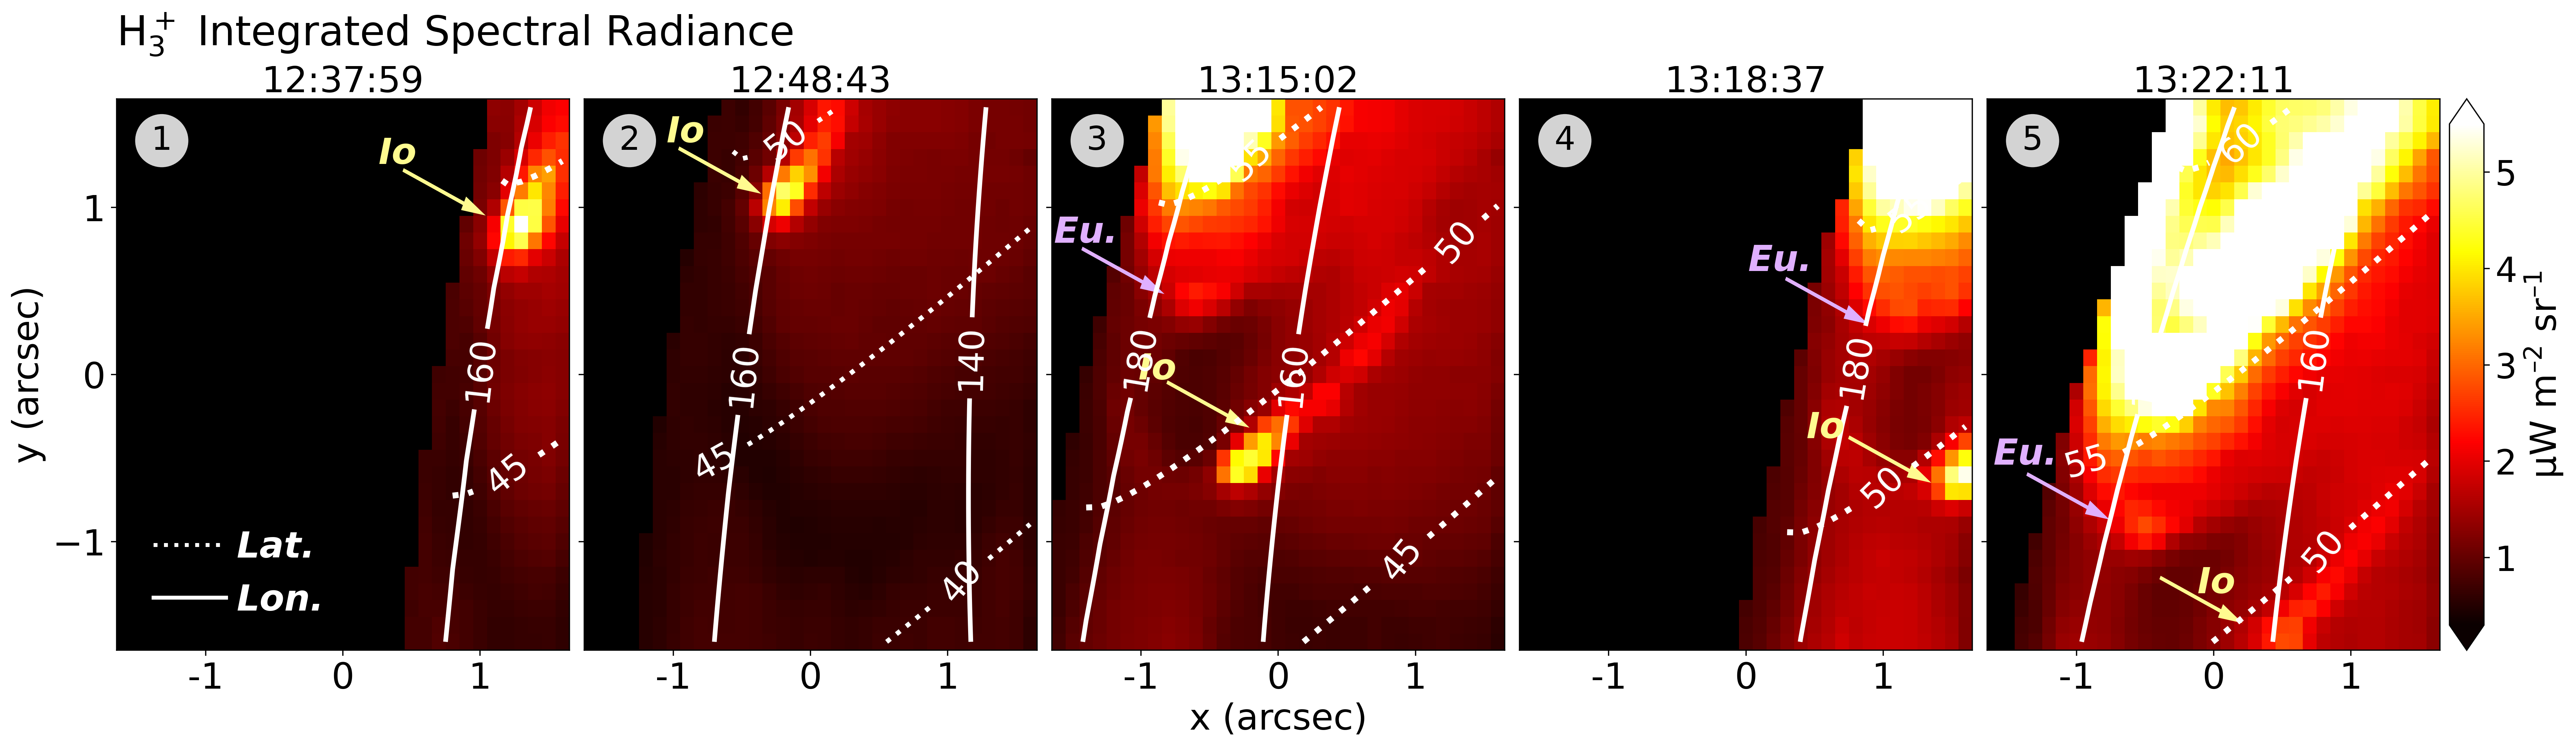
JWST/NIRSpec IFU observations of the auroral footprints of Io and Europa, indicated by yellow and purple arrows, respectively. We display the integrated H3+ spectral radiance with planetocentric latitude at 550 km above the 1-bar level (dotted) and System III (West) longitude (solid). UTC mid-points of integration are given above, and the circled numbers refer to the exposure label.