MIST
Magnetosphere, Ionosphere and Solar-Terrestrial
Long-term variations in solar wind parameters, magnetopause location, and geomagnetic activity over the last five solar cycles
by Andrey Samsonov (Mullard Space Science Laboratory, UCL)
The magnetopause is a natural boundary between the solar wind and magnetospheric plasmas. Geosynchronous orbit, where numerous communications, meteorological and GPS satellites operate, is usually located in the magnetosphere but occasionally due to variable solar wind conditions the magnetosphere may significantly compress and those satellites will cross the magnetopause and get in direct contact with the solar wind plasma. Fast streams of dense solar wind plasma as well as solar energetic particles might damage the satellites. Therefore the study of variations of the magnetopause standoff distance is an important problem of space physics. The magnetopause location can be described by empirical models (e.g. Shue et al., 1998; Lin et al., 2010).
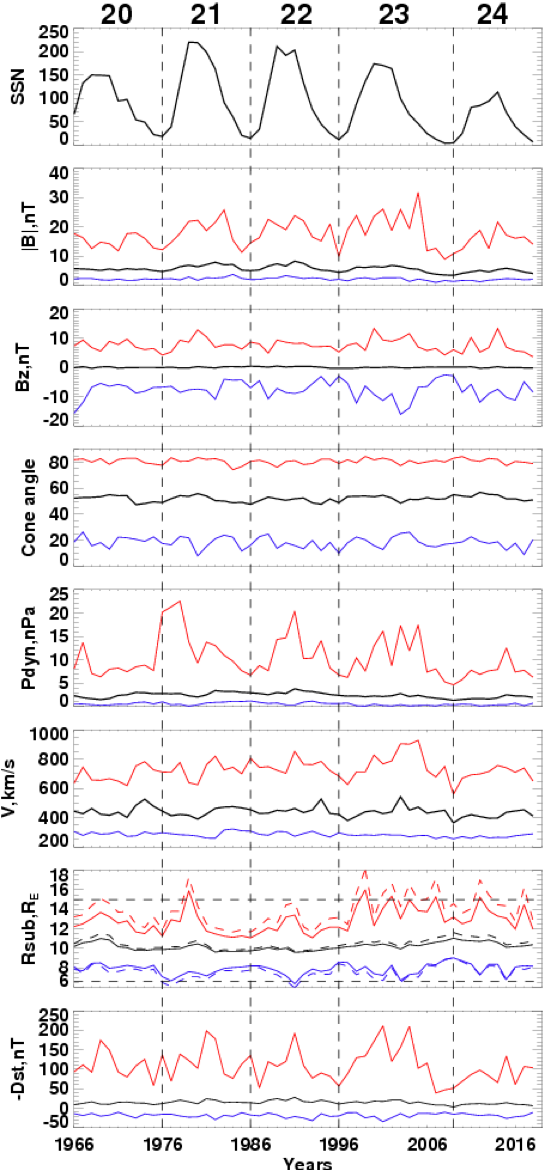
In our recent work, we studied long term changes in the magnetopause position. We use both OMNI solar wind observations and empirical magnetopause models to reconstruct time series of the magnetopause standoff distance for nearly five solar cycles (from 1966 to 2018). The magnetopause standoff distance on this time scale depends mostly on the solar wind dynamic pressure (Pdyn). The 11-year solar cycles in the Pdyn variations are superimposed by an increasing trend before 1991 and a decreasing trend between 1991 and 2009. Correspondingly, we find that the standoff distance predicted by magnetopause models increases by nearly 2 RE from 1991 to 2009. The annual sunspot number (SSN), IMF magnitude and magnetospheric geomagnetic activity indices display the same trends as the dynamic pressure. We calculate extreme solar wind parameters and magnetopause standoff distance in each year using daily values and find that both extremely small and large standoff distances during a solar cycle preferably occur at solar maximum rather than at solar minimum (see figure below).
Furthermore, we calculated correlations between annual average solar wind and magnetospheric parameters, and the SSN. The annual IMF magnitude well correlates with SSN with a zero time lag, while the annual Pdyn correlates reasonably well with the SSN but with 3-years time lag. Both the annual solar wind density and velocity well correlate with the dynamic pressure, but the correlation coefficient is higher for density than for velocity. The annual Kp index better correlates with Pdyn, while Dst index better correlates with Bs (negative IMF Bz). This correlation analysis helps to better understand relations between solar, solar wind and magnetospheric parameters on the long time scale.
The knowledge of predicted magnetopause position for the next solar cycle is important for future space missions, especially for those which are intended to observe the dayside magnetopause whether in situ or remotely. One of the forthcoming missions which will study variations of the dayside magnetopause is the Solar Wind Magnetosphere Ionosphere Link Explorer (SMILE).
For more information, please see the paper below:
Samsonov, A. A., Bogdanova, Y. V., Branduardi‐Raymont, G., Safrankova, J., Nemecek, Z., & Park, J.‐S. ( 2019). Long‐term variations in solar wind parameters, magnetopause location, and geomagnetic activity over the last five solar cycles. Journal of Geophysical Research: Space Physics, 124. https://doi.org/10.1029/2018JA026355

Figure: The sunspot numbers, average and extreme IMF magnitude and Bz, IMF cone angle (the angle between IMF vector and xaxis), solar wind dynamic pressure and velocity, magnetopause standoff distance (solid lines for Shue et al.'s model and dashed lines for Lin et al.'s model), and geomagnetic Dst index. Annual average values shown by black, daily maximal and minimal values for each year shown by red and blue. Vertical lines separate solar cycles as indicated by numbers at the top.