MIST
Magnetosphere, Ionosphere and Solar-Terrestrial
Directed network of substorms using SuperMAG ground-based magnetometer data
by Lauren Orr (University of Warwick)
Space weather can cause large-scale currents in the ionosphere which generate disturbances of magnetic fields on the ground. These are observed by >100 magnetometer stations on the ground. Network analysis can extract the important information from these many observations and present it as a few key parameters that indicate how severe the ground impact will be. We quantify the spatio-temporal evolution of the substorm ionospheric current system utilizing the SuperMAG 100+ magnetometers, constructing dynamical directed networks from this data for the first time.
Networks are a common analysis tool in societal data, where people are linked based on various social relationships. Other examples of networks include the world wide web, where websites are connected via hyperlinks, or maps where places are linked via roads. We have constructed networks from the magnetometer observations of substorms, where magnetometers are linked if there is significant correlation between the observations. If the canonical cross-correlation (CCC) between vector magnetic field perturbations observed at two magnetometer stations exceeds a threshold, they form a network connection. The time lag at which CCC is maximal, |τC|, determines the direction of propagation or expansion of the structure captured by the network connection. If spatial correlation reflects ionospheric current patterns, network properties can test different models for the evolving substorm current system.
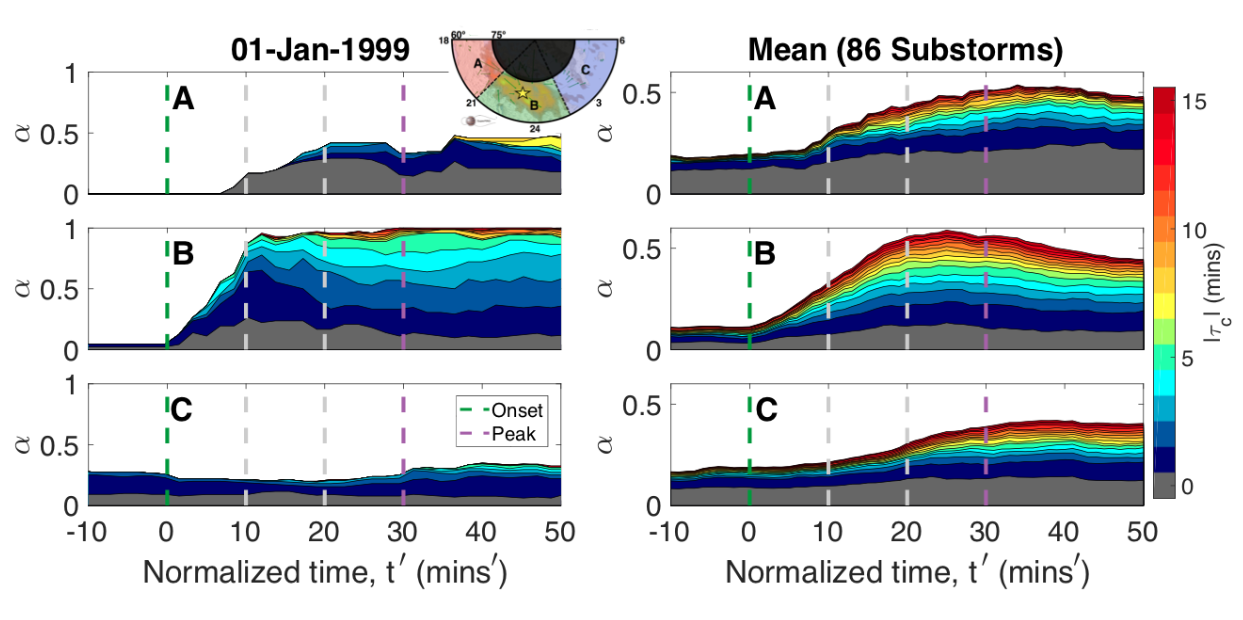
In this study, we select 86 isolated substorms based on nightside ground station coverage. The results are shown for both a single event and for all substorms in the figure. We find, and obtain the timings for, a consistent picture in which the classic substorm current wedge (SCW) forms, quantifying both formation and expansion. A current system is seen pre-midnight following the SCW westward expansion. Later, there is a weaker signal of eastward expansion. Finally, there is evidence of substorm-enhanced magnetospheric convection. These results demonstrate the capabilities of network analysis to understand magnetospheric dynamics and provide new insight into how the SCW develops and evolves during substorms.
For more information please see the paper below:
Orr, L., Chapman, S. C., and Gjerloev, J. W.. ( 2019), Directed network of substorms using SuperMAG ground‐based magnetometer data. Geophys. Res. Lett., 46. https://doi.org/10.1029/2019GL082824

Figure: The normalized number of connections, α(t',τC), is binned by the lag of maximal canonical cross-correlation, |τC|. Each panel stacks, one above the other, α(t',τC) versus normalized time, t’, for |τC|≤15. The regions are indicated on the polar plot and the regions were determined using Polar VIS images of the auroral bulge at the time of maximum expansion. Region B (around onset) exhibits a rapid increase in correlation following substorm onset.