MIST
Magnetosphere, Ionosphere and Solar-Terrestrial
Chandra Observations of Jupiter's X-ray Auroral Emission During Juno Apojove 2017
By Dale Weigt (University of Southampton)
Jupiter has dynamic auroral X-ray emissions, first observed over 40 years ago. A key characteristic of Jupiter’s aurora are “hot spots” of soft X-rays at the poles, which we observe from the Chandra X-ray Observatory (CXO) with high spatial resolution. These non-conjugate northern (Gladstone et al. 2002 + others) and southern auroral hot spots (Dunn et al. 2017 + others) are found in several observation campaigns to flare quasi-periodically. However, the driver of the X-rays (and hence their link to solar wind and magnetospheric conditions) is currently unknown.
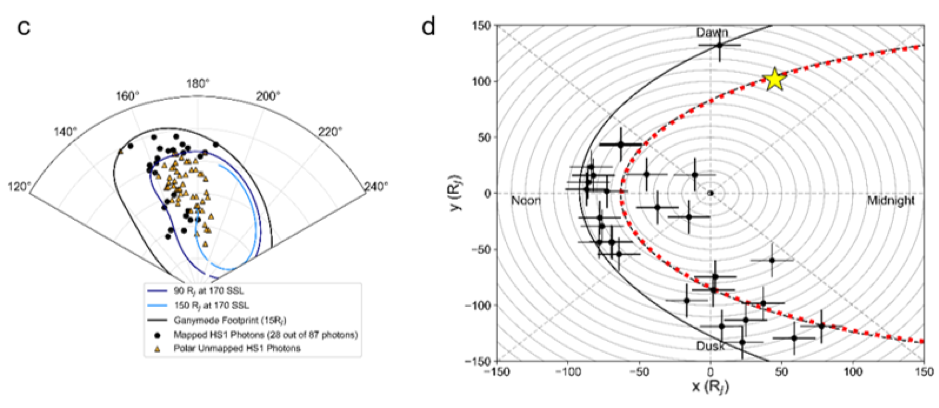
In the Weigt at. (2020) case study, we analyse CXO data from 18th June 2017 during a 10-hour observation where Juno was near its apojove position. An XMM-Newton observation overlapped the latter half of this observation (Wibisono et al. 2020). From the particle data, we find that Juno crossed the magnetopause several times preceding the Chandra observation. Using the closest crossing and amagnetopause model, we inferred a compressed magnetosphere during this interval. Using a numerical threshold to define spatial regions of concentrated photons, we find that the hot spot in the north appeared twice during the observation with a more extended morphology. Using Rayleigh testing, we find significant quasi-periodic oscillations (QPO) during both instances the hot spot was in view at ~ 37 min and 26 min respectively. The 26-min QPO was also observed by XMM-Newton and was found to remain for a further two Jupiter rotations. Using the Vogt et al. (2011, 2015) flux equivalence model, we map the origin of the QPOs and X-ray driver to be on the dayside-dusk magnetopause boundary, considering the caveats of the model. The timescales of the periods found suggest that the driver may be linked to magnetospheric processes producing ultra-low frequency waves (ULF).

Figure 1: (c) polar plot of Jupiter’s north pole showing the observed mapped and unmapped photons (black dots and orange triangles respectively)at the beginning of the observation interval. (d) The photons are mapped to their magnetospheric origins using the Vogt et al. (2011, 2015) model, where error bars show the estimated mapping errors. The red dashed line indicates the magnetopause boundary inferred from the Juno data during the Chandra observation. The location of Juno during this time is denoted by the yellow star.
These results demonstrate the capabilities of CXO data in understanding the “hot spots” in Jupiter’s aurora, and can provide important contextual information to Juno observations. This study is also the first to find two significant QPOs in the northern hot spot over timescales less than a Jupiter rotation.
For more details, see the paper:
Weigt, D. M., Jackman, C. M., Dunn W. R., Gladstone G.R., Vogt M. F., Wibisono A. D., et al (2020). Chandra Observation of Jupiter’s X-rays Auroral Emission During Juno Apojove 2017 Journal of Geophysical Research: Planets, 125, e2019JE006262. https://doi.org/10.1029/2019JE006262
