MIST
Magnetosphere, Ionosphere and Solar-Terrestrial
Temporal and Spectral Studies by XMM-Newton of Jupiter’s X-ray Auroras During a Compression Event
By Affelia Wibisono (Mullard Space Science Laboratory, UCL)
Out of all of Jupiter’s aurorae, its X-ray aurora is unique as it is produced by the interactions between the constituents of Jupiter’s atmosphere with both ions and electrons. Furthermore, the X-rays are emitted by the precipitating particles rather than the native Jovian species. The X-ray aurorae are fixed on Jupiter’s frame and often exhibit quasi-periodic oscillations (QPOs) with periods of tens of minutes (e.g. Dunn et al., 2017), however, the origins of the precipitating particles and the source of the QPOs remain to be fully understood.
Contemporaneous observations by XMM-Newton and Chandra of Jupiter’s X-ray aurorae occurred for five hours in June 2017 while Juno was at near apojove. XMM-Newton continued to survey the emissions for a further 18 hours. The southern aurora was visible to XMM-Newton three times while the northern aurora was only seen twice. The planet’s magnetosphere was shown to be compressed by the solar wind during this time.
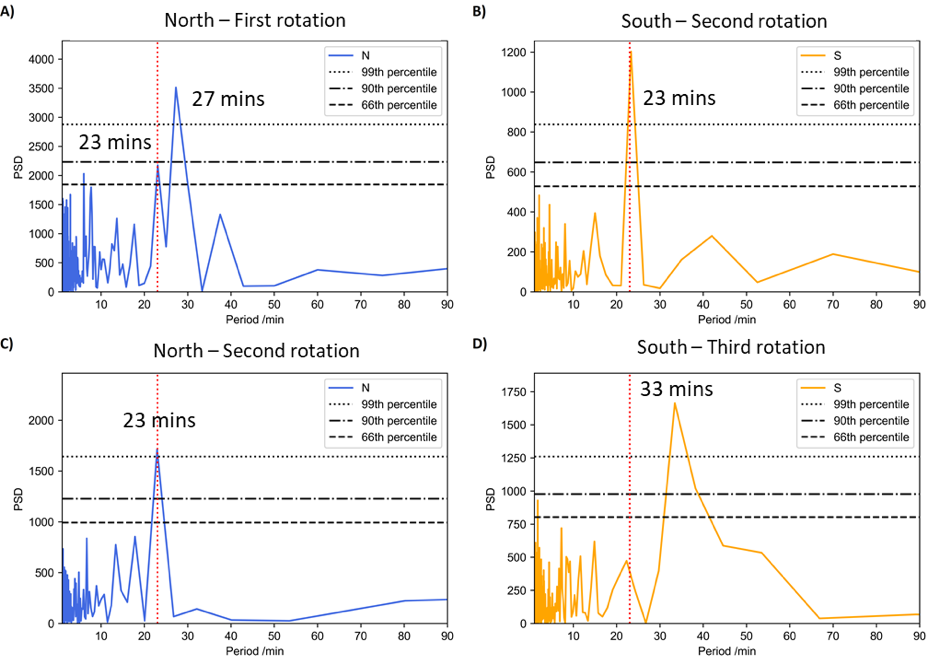
Wibisono et al., 2020 applied discrete wavelet and Fast Fourier Transforms (FFT) on the XMM-Newton auroral lightcurves from both poles. Figure 1 shows the power spectral density (PSD) plots from the FFT analysis in chronological order. QPOs were not found in the southern lights when it was first in view hence why its PSD plot is not included. The first rotation in the north had a strong pulse with a period of 27 minutes; a result that Chandra agrees with (Weigt et al., 2020). There is a secondary, less powerful beat at 23 minutes that is also observed in the south and then again in the north. This period lasts for a total duration of 12.5 hours, marking it the first time that both poles are seen to pulsate with the same period, at the same time and for more than one Jupiter rotation. The period increased to 33 minutes in the final rotation. The observed periods indicate that ultra-low frequency waves are a likely cause of the pulsations.

Figure 1: The power spectral density (PSD) plots after the Fast Fourier Transform was applied on the time intervals when regular pulsations occurred. PSDs A and C are for the entire first rotation and start of the second rotation of the northern aurora respectively. PSDs B and D are for the beginning of the second and entire third rotation of the southern aurora respectively. The dashed, dashed-dot and dotted black lines mark the 66th, 90th and 99th percentiles which were calculated by using Monte Carlo methods to produce 10 000 simulated lightcurves and determining the frequency of a periodicity of the observed power was randomly generated. The vertical red dashed lines show when the period is equal to 23 minutes. There were no regular pulsations in the first rotation in the south.
Spectral analysis of the XMM-Newton dataset gave the surprising result that during this particular magnetospheric compression event, the precipitating ions were from inside Jupiter’s magnetosphere. This outcome provides an insight into what drives Jupiter’s X-ray aurorae that have significant implications for our understanding of the wider magnetospheric dynamics at Jupiter.
For more details, see the paper:
Wibisono, A. D., Branduardi‐Raymont, G., Dunn, W. R., Coates, A. J., Weigt, D. M., Jackman, C. M., et al ( 2020). Temporal and Spectral Studies by XMM‐Newton of Jupiter's X‐ray Auroras During a Compression Event. Journal of Geophysical Research: Space Physics, 125, e2019JA027676. https://doi.org/10.1029/2019JA027676
