MIST
Magnetosphere, Ionosphere and Solar-Terrestrial
AE, DST and their SuperMAG Counterparts: The Effect of Improved Spatial Resolution in Geomagnetic Indices
By Aisling Bergin (University of Warwick)
Magnetometer stations on the ground are used to monitor and specify changes in the magnetosphere - ionosphere system. Geomagnetic indices based on measurements from these stations are used extensively and they have been recorded for many decades. Two examples are AE and DST , which are indices designed to measure the evolution and intensity of the auroral electrojets and the ring current, respectively. The SuperMAG collaboration have made new versions of these indices available, SME and SMR. They are based on a larger number of magnetometer stations than the original AE and DST indices.
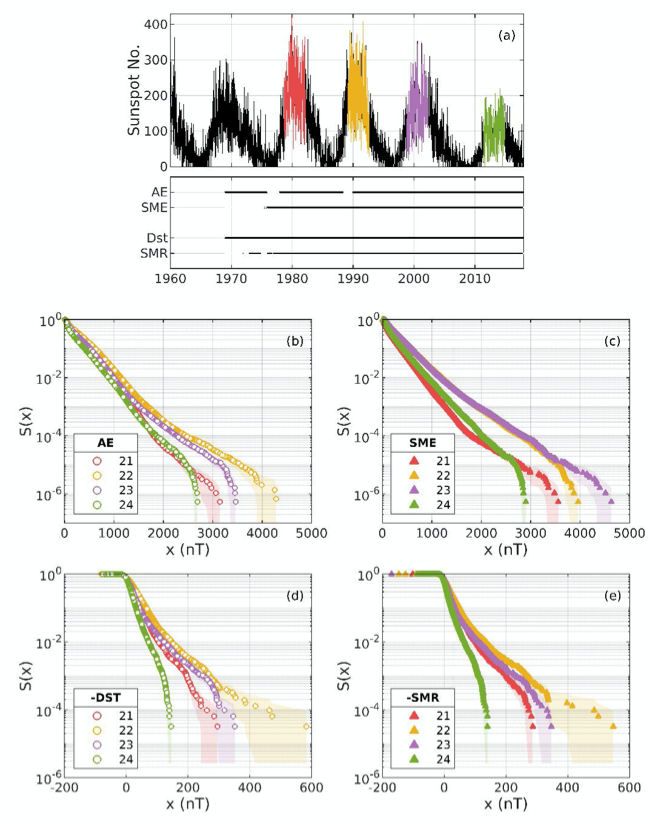
Bergin et al. (2020) presents a statistical comparison of AE and DST geomagnetic indices with SME and SMR, their higher spatial resolution SuperMAG counterparts. As the number of magnetometer stations in the SuperMAG network increases over time, so does the spatial resolution of SME and SMR. Our statistical comparison between the established indices and their new SuperMAG counterparts finds that, for large excursions in geomagnetic activity, AE systematically underestimates SME for later cycles. The difference between distributions of recorded AE and SME values for a single solar maximum can be of the same order as changes in activity seen from one solar cycle to the next. We show that it in the case of AE and SME, it is not possible to simply translate between the two indices. We demonstrate that DST and SMR track each other but are subject to an approximate linear shift as a result of the procedure used to map stations to the magnetic equator. These results have demonstrated that important differences exist between the indices, and informs how and when these indices should be used.

Figure 1. Survival distributions of geomagnetic indices. (a) Sunspot number for the last five solar cycles are plotted (black); coloured regions indicate periods of solar maximum from which data are used for the statistical comparison of maxima of Cycles 21 (red), 22 (yellow), 23 (purple) and 24 (green). Corresponding dates of AE, SME, DST and SMR index data availability are indicated in the black line plot below. Survival distributions based on the empirical cumulative density function of electrojet indices (b) AE and (c) SME and ring current indices (d) DST and (e) SMR are plotted for each of the four solar maxima; uncertainties are estimated using the Greenwood error formula and are indicated by shading.
Please see the paper for full details:
Bergin, A., Chapman, S. C., & Gjerloev, J. W. (2020). AE, DST and their SuperMAG Counterparts: The Effect of Improved Spatial Resolution in Geomagnetic Indices. Journal of Geophysical Research: Space Physics, 125, e2020JA027828. https://doi.org/10.1029/2020JA027828