MIST
Magnetosphere, Ionosphere and Solar-Terrestrial
Plasma density gradients at the edge of polar ionospheric holes: the absence of phase scintillation
By Luke Jenner (Nottingham Trent University)
The high-latitude ionosphere is a highly structured medium. Large-scale plasma structures with a horizontal extent of tens to hundreds of kilometres are routinely observed and it is well known that these can disrupt radio waves such as those used for Global Navigation Satellite System (GNSS). One such structure, a polar ionospheric hole, is a sharp depletion of plasma density. In this paper polar holes were observed in the high-latitude ionosphere during a series of multi-instrument case studies close to the Northern Hemisphere winter solstice in 2014 and 2015. These holes were observed during geomagnetically quiet conditions and under a range of solar activities using the European Incoherent Scatter (EISCAT) Svalbard Radar (ESR) and measurements from GNSS receivers. The edges of the polar holes were characterised by steep gradients in the electron density. Such electron density gradients have been associated with phase scintillation in previous studies; however, no enhanced scintillation was detected within the electron density gradients at these boundaries. It is suggested that the lack of phase scintillation may be due to low plasma density levels and a lack of intense particle precipitation. In a review paper Aarons (1982) suggested that a minimum density level may be required for scintillation to occur, and our observations support this idea. We conclude that both significant electron density gradients and plasma density levels above a certain threshold are required for scintillation to occur.

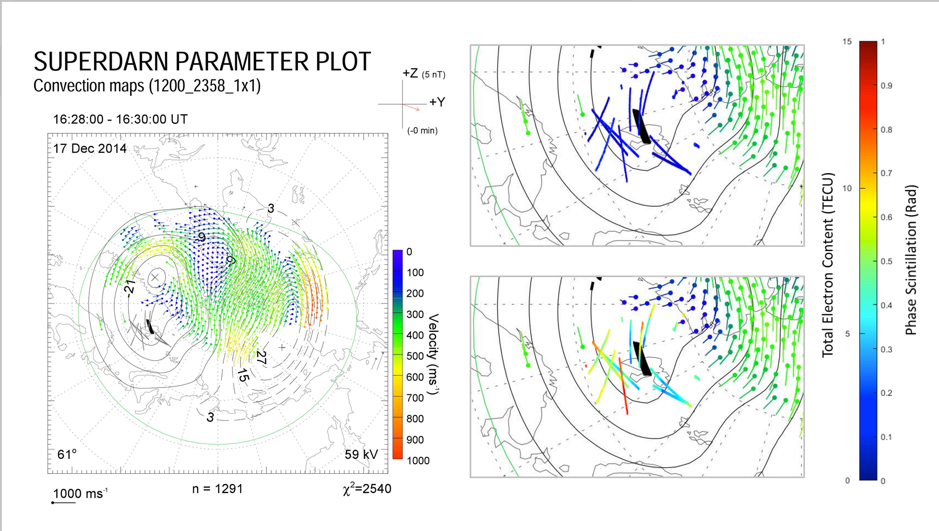
Figure: Electric potential patterns inferred from the SuperDARN radars for 17:14 UT on 17 December 2014 as a function of geomagnetic latitude and magnetic local time. Magnetic noon is shown at the top of panels with dusk and dawn on the left- and right-hand sides respectively and magnetic midnight at the bottom. Magnetic latitude is indicated by the grey dashed circular lines at 10.0◦ increments. The grey lines show the location of satellite passes from GNSS satellites, assuming an ionospheric intersection of 350 km. The SuperDARN plot from 17:14 UT plot includes satellite passes from 16:58 to 17:28 UT. These time intervals were chosen as the inspection of the whole SuperDARN data set at a 2 min resolution indicated that the convection patterns were relatively stable during these intervals. The panels on the right half show the area around the satellite passes in more detail. Colours represent phase scintillation in the top right panel and TEC in the bottom right panel. The thick black line indicates the position of the polar hole observed using the 42 m dish of the EISCAT Svalbard Radar.
For more information, please see the paper:
Jenner, L. A., Wood, A. G., Dorrian, G. D., Oksavik, K., Yeoman, T. K., Fogg, A. R., and Coster, A. J.: Plasma density gradients at the edge of polar ionospheric holes: the absence of phase scintillation, Ann. Geophys., 38, 575–590, https://doi.org/10.5194/angeo-38-575-2020, 2020.