MIST
Magnetosphere, Ionosphere and Solar-Terrestrial
An Improved Estimation of SuperDARN Heppner-Maynard Boundaries using AMPERE data
By Alexandra R Fogg (University of Leicester)
The transport of magnetic flux through the terrestrial magnetosphere is communicated to the ionosphere, resulting in the circulation of plasma known as ionospheric convection. The Super Dual Auroral Radar Network (SuperDARN) measures the movements of ionospheric plasma, and its data can be assimilated into a global map of electrostatic potential, known as an ionospheric convection map. The low latitude boundary of the SuperDARN ionospheric convection region is known as the Heppner-Maynard Boundary (HMB). The determination of the latitude of the HMB depends on the availability of radar backscatter, which varies temporally and spatially.
In this study, the midnight meridian latitude of the HMB, Λ0, is compared with a scale size for the field-aligned current (FAC) region, from the Active Magnetosphere and Planetary Electrodynamics Response Experiment (AMPERE). Since both the convection and FAC regions are related to the polar cap boundary, the relationship between the scale sizes for the two systems could be expected to be linear, as both will expand and contract with the movement of the polar cap boundary. The midnight meridian latitude of the boundary between the Region 1 and Region 2 FACs, RF, is used to characterise the size of the FAC region.
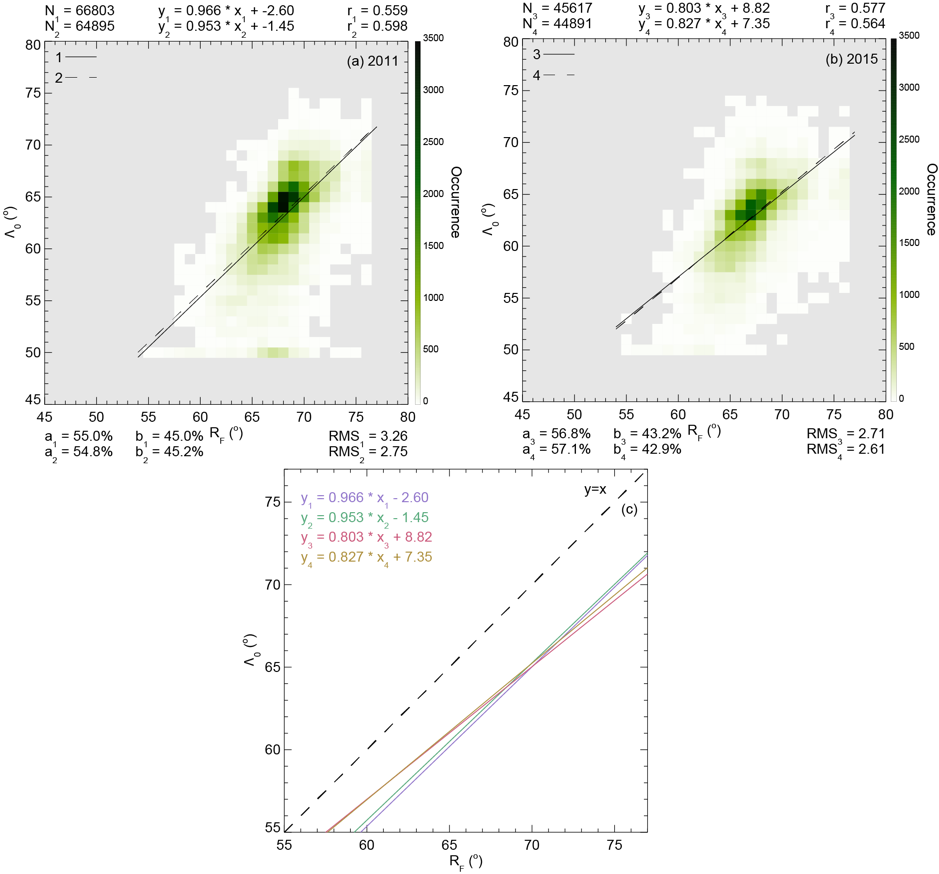
In order to assess solar cycle variations, Λ0 and RF data were gathered from 2011 and 2015. After the application of some data selection criteria, linear regression analysis was performed on the two datasets, which are presented in Figure 1(a) and (b). There is a clear linear trend in the main cluster of data for both 2011 and 2015, and the resulting lines of best fit have gradients close to 1. As can be seen from Figure 1(c), in the areas of greatest occurrence for both years, the predicted values of Λ0 from the trends are very similar, although there are differences at the extremes of the dataset.
The results present a new reliable method of determining the latitude of the SuperDARN HMB from AMPERE RF measurements, where such predictions are independent of variations in radar backscatter availability.

Figure 1 (a) Occurrence of RF as a function of Λ0 for 2011 data, after some data selection criteria. Linear trend from the dataset is overplotted as a solid black line (1), and the equation is recorded at the top. Linear trend after the removal of some outliers is overplotted as a dashed black line (2). For both trends, the number of points in the dataset (N), correlation coefficient of the fit (r), percentage of points above and below (a and b) the line and RMS error (RMS) are recorded above and below the panel. (b) As for (a) but for 2015 data. (c) All four trends presented in (a) and (b) plotted together on a different scale.
For more information please see:
Fogg, A. R., Lester, M., Yeoman, T. K., Burrell, A. G., Imber, S. M., Milan, S. E., et al. (2020). An improved estimation of SuperDARN Heppner-Maynard boundaries using AMPERE data. Journal of Geophysical Research: Space Physics, 125, e2019JA027218. https://doi.org/10.1029/2019JA027218