MIST
Magnetosphere, Ionosphere and Solar-Terrestrial
Data Assimilation and the Solar Wind
By Harriet Turner (University of Reading)
Data assimilation (DA) combines model output and observations to form an optimal estimation of reality. It has led to large improvements in terrestrial weather prediction, reducing the “butterfly effect”, by which small errors in the initial conditions can grow non-linearly and lead to large errors in the subsequent forecast.
DA has been used in three main areas for space weather forecasting: the ionosphere, the photosphere, and, more recently, the solar wind. The first attempts at using DA for solar wind forecasting has shown promise, with a reduction in forecast error (Lang, 2021).
I have been using the Burger Radius Variational Data Assimilation (BRaVDA) scheme (Lang, 2019). This uses output from a coronal model with a computationally efficient solar wind model (HUX; Riley and Lionello, 2011) to map information from in-situ observations at Earth’s orbital radius (215 solar radii), back to the HUX inner boundary at 30 solar radii. The inner boundary conditions are then updated, given the information from the in-situ observations. This update is then run forward in time, again using HUX, to produce a reconstruction of the solar wind. This can then be used for forecasting.
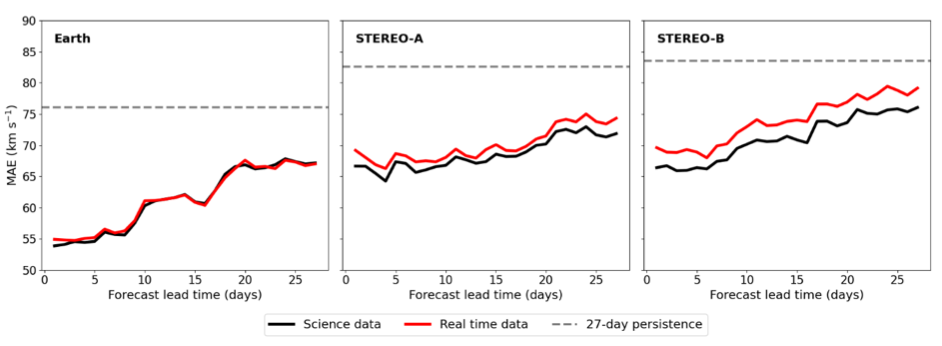
We have three sources of observations: STEREO-A, STEREO-B, and the OMNI dataset for near-Earth space. For the purposes of my work, I am using a simple corotation to produce a forecast. We can compare this forecast against observations from the three sources to assess its performance. Recently, I have been looking at testing the performance of BRaVDA with real time data. Previous experiments have used cleaned-up, science-level data, but real time data would need to be used for an operational DA scheme. Initial results show that using the real time data does not worsen the forecasts significantly and is still an improvement from a 27-day persistence forecast, as shown in Figure 1, which is promising for future implementation of solar wind DA.

Figure 1: Mean absolute error (MAE) of solar wind forecasts as a function of forecast lead time, for the case where OMNI, STEREO-A and STEREO-B observations are assimilated together. The black line shows the forecast where the science-level data was used and the red line when real time data was used. The dashed grey line shows the average 27-day persistence MAE for the specific spacecraft. The left-hand panel shows the forecast at Earth, the middle panel shows the forecast at STEREO-A and the right-hand panel shows the forecast at STEREO-B. This covers the period from 01/04/2012 to 01/10/2013.
References:
Lang, M., & Owens, M. J. (2019). A Variational Approach to Data Assimilation in the Solar Wind. Space Weather, 17(1), 59 – 83. Doi: 10.1029/2018SW001857.
Lang, M., Witherington, J., Owens, M. J., & Turner, H. (2021). Improving solar wind forecasting using data assimilation. Space Weather, 1 – 23.
Riley, P., & Lionello, R. (2011). Mapping Solar Wind Streams from the Sun to 1 AU: A Comparison of Techniques. Solar Physics, 270(2), 575 – 592. Doi: 10.1007/s11207-001-9766-x.
