MIST
Magnetosphere, Ionosphere and Solar-Terrestrial
The Harmonic Frequency Separation of Ionospheric Alfvén Resonances at Eskdalemuir
Rosie Hodnett (University of Leicester)
Ionospheric Alfvén resonances (IAR) occur when Alfvén waves are partially reflected at boundaries in the ionosphere where there are large changes in plasma mass density. These boundaries are the bottom of the ionosphere and above the F-Region peak. This sets up a resonance (Belyaev et al., 1990).
IAR have been observed in the induction coil magnetometer data at Eskdalemuir Geophysical Observatory, which is a British Geological Survey site (Beggan & Musur, 2018).
We have modelled the harmonic frequency separation (Δf) of the IAR, by modelling the Alfvén velocity and calculating the time taken for the wave to travel up and down the IAR cavity. We used the International Reference Ionosphere to model the plasma mass density and the International Geomagnetic Reference Field to model the magnetic field strength.
To find the average Δf from the data, we used machine learning to identify the IAR harmonics in spectrograms, and then automatically extracted the frequencies. We used a u-net (Ronneberger et al., 2015) which was developed by Marangio et al. (2020) to detect the IAR.
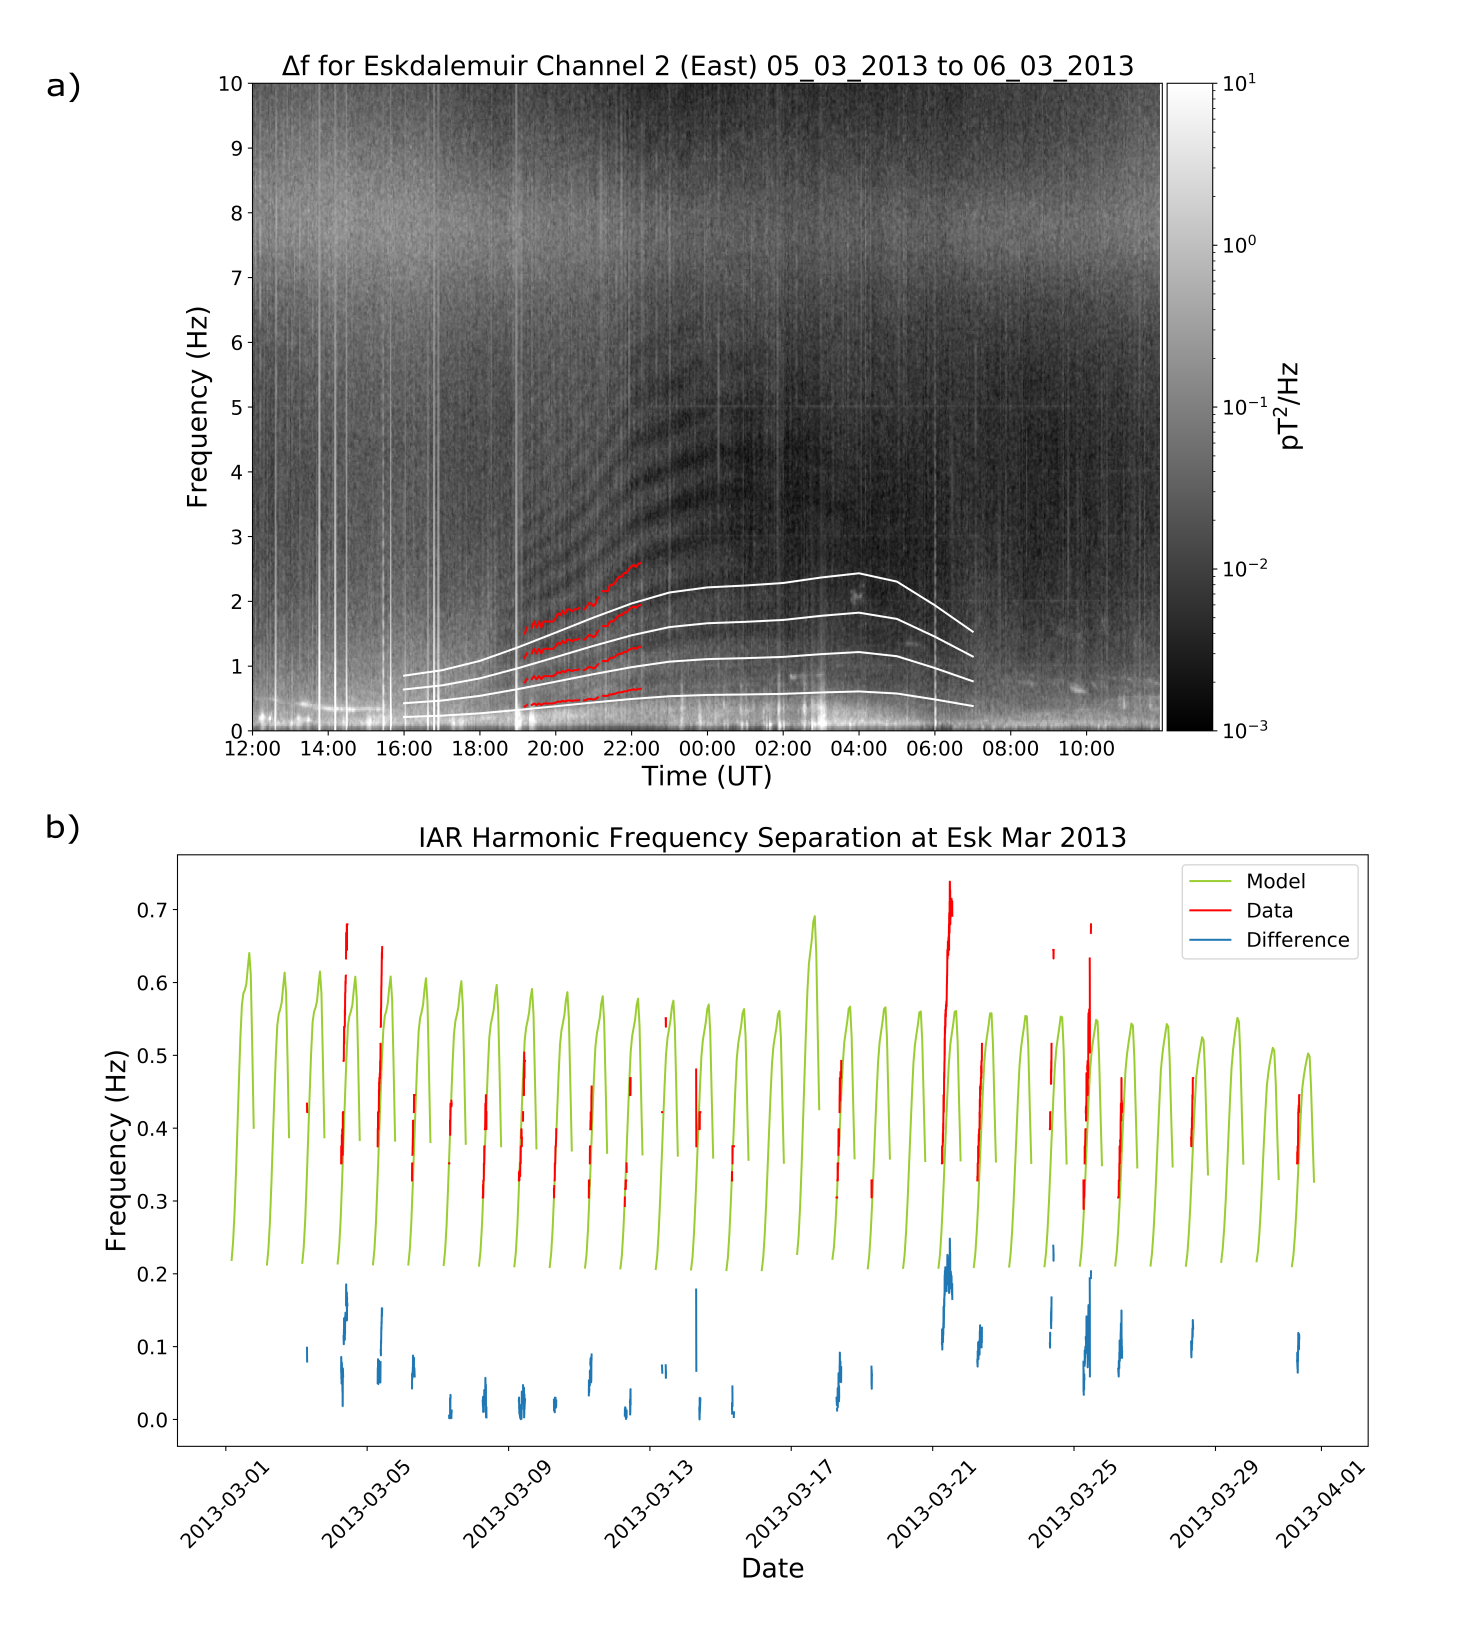
Figure a) shows the spectrogram for 05/03/2013 – 06/03/2013. The IAR harmonics are visible as bright fringes. The red line lowest in frequency is the average Δf extracted from the data, with subsequent red lines being 2 x Δf, 3 x Δf and 4 x Δf. These are plotted so we can see the Δf following the trends of the harmonics. The lowest white line is the modelled Δf, with higher white lines being higher orders. Generally, the model agrees fairly well with the data. Here, both the data and the model show Δf increasing from dusk to midnight. The data diverges from the model later on, indicating that the model does not accurately capture the ionosphere at this time.
Figure (b) shows the modelled Δf in green, Δf from the data in red and the absolute difference between them in blue, for March 2013. Overall, the data and the model agree well. On 21/03/2013, there is a greater difference between the model and data than other days. Examples like this will be investigated further.
We are now performing further analysis of the 9 year dataset, including a comparison of the data and model to foF2, sunspot number, Sym-H and Kp.

References:
Beggan, C. D., & Musur, M. (2018). Observation of Ionospheric Alfvén Resonances at 1-30 Hz and their Superposition with the Schumann Resonances. Journal of Geophysical Research: Space Physics, 123 (5), 4202–4214. doi: 10.1029/2018ja025264
Belyaev, P., Polyakov, S., Rapoport, V., & Trakhtengerts, V. (1990). The Ionospheric Alfvén Resonator. Journal of Atmospheric and Terrestrial Physics, 52 (9), 781–788. doi: 10.1016/0021-9169(90)90010-k
Marangio, P., Christodoulou, V., Filgueira, R., Rogers, H. F., & Beggan, C. D. (2020). Automatic Detection of Ionospheric Alfvén Resonances in Magnetic Spectrograms using U-Net. Computers amp; Geosciences, 145 , 104598. doi:10.1016/j.cageo.2020.104598
Ronneberger, O., Fischer, P., & Brox, T. (2015). U-Net: Convolutional Networks for Biomedical Image Segmentation. Lecture Notes in Computer Science, 234–241. doi:10.1007/978-3-319-24574-4 287
Acknowledgements:
BGS: www.geomag.bgs.ac.uk/operations/eskdale.html
IRI: www.irimodel.org
IGRF: https://www.ngdc.noaa.gov/IAGA/vmod/igrf.html
