MIST
Magnetosphere, Ionosphere and Solar-Terrestrial
Observation of Quiet-Time Mid-Latitude Joule Heating and Comparisons With the TIEGCM Simulation
By Maria-Theresia Walach & Elliot Day (Lancaster University)
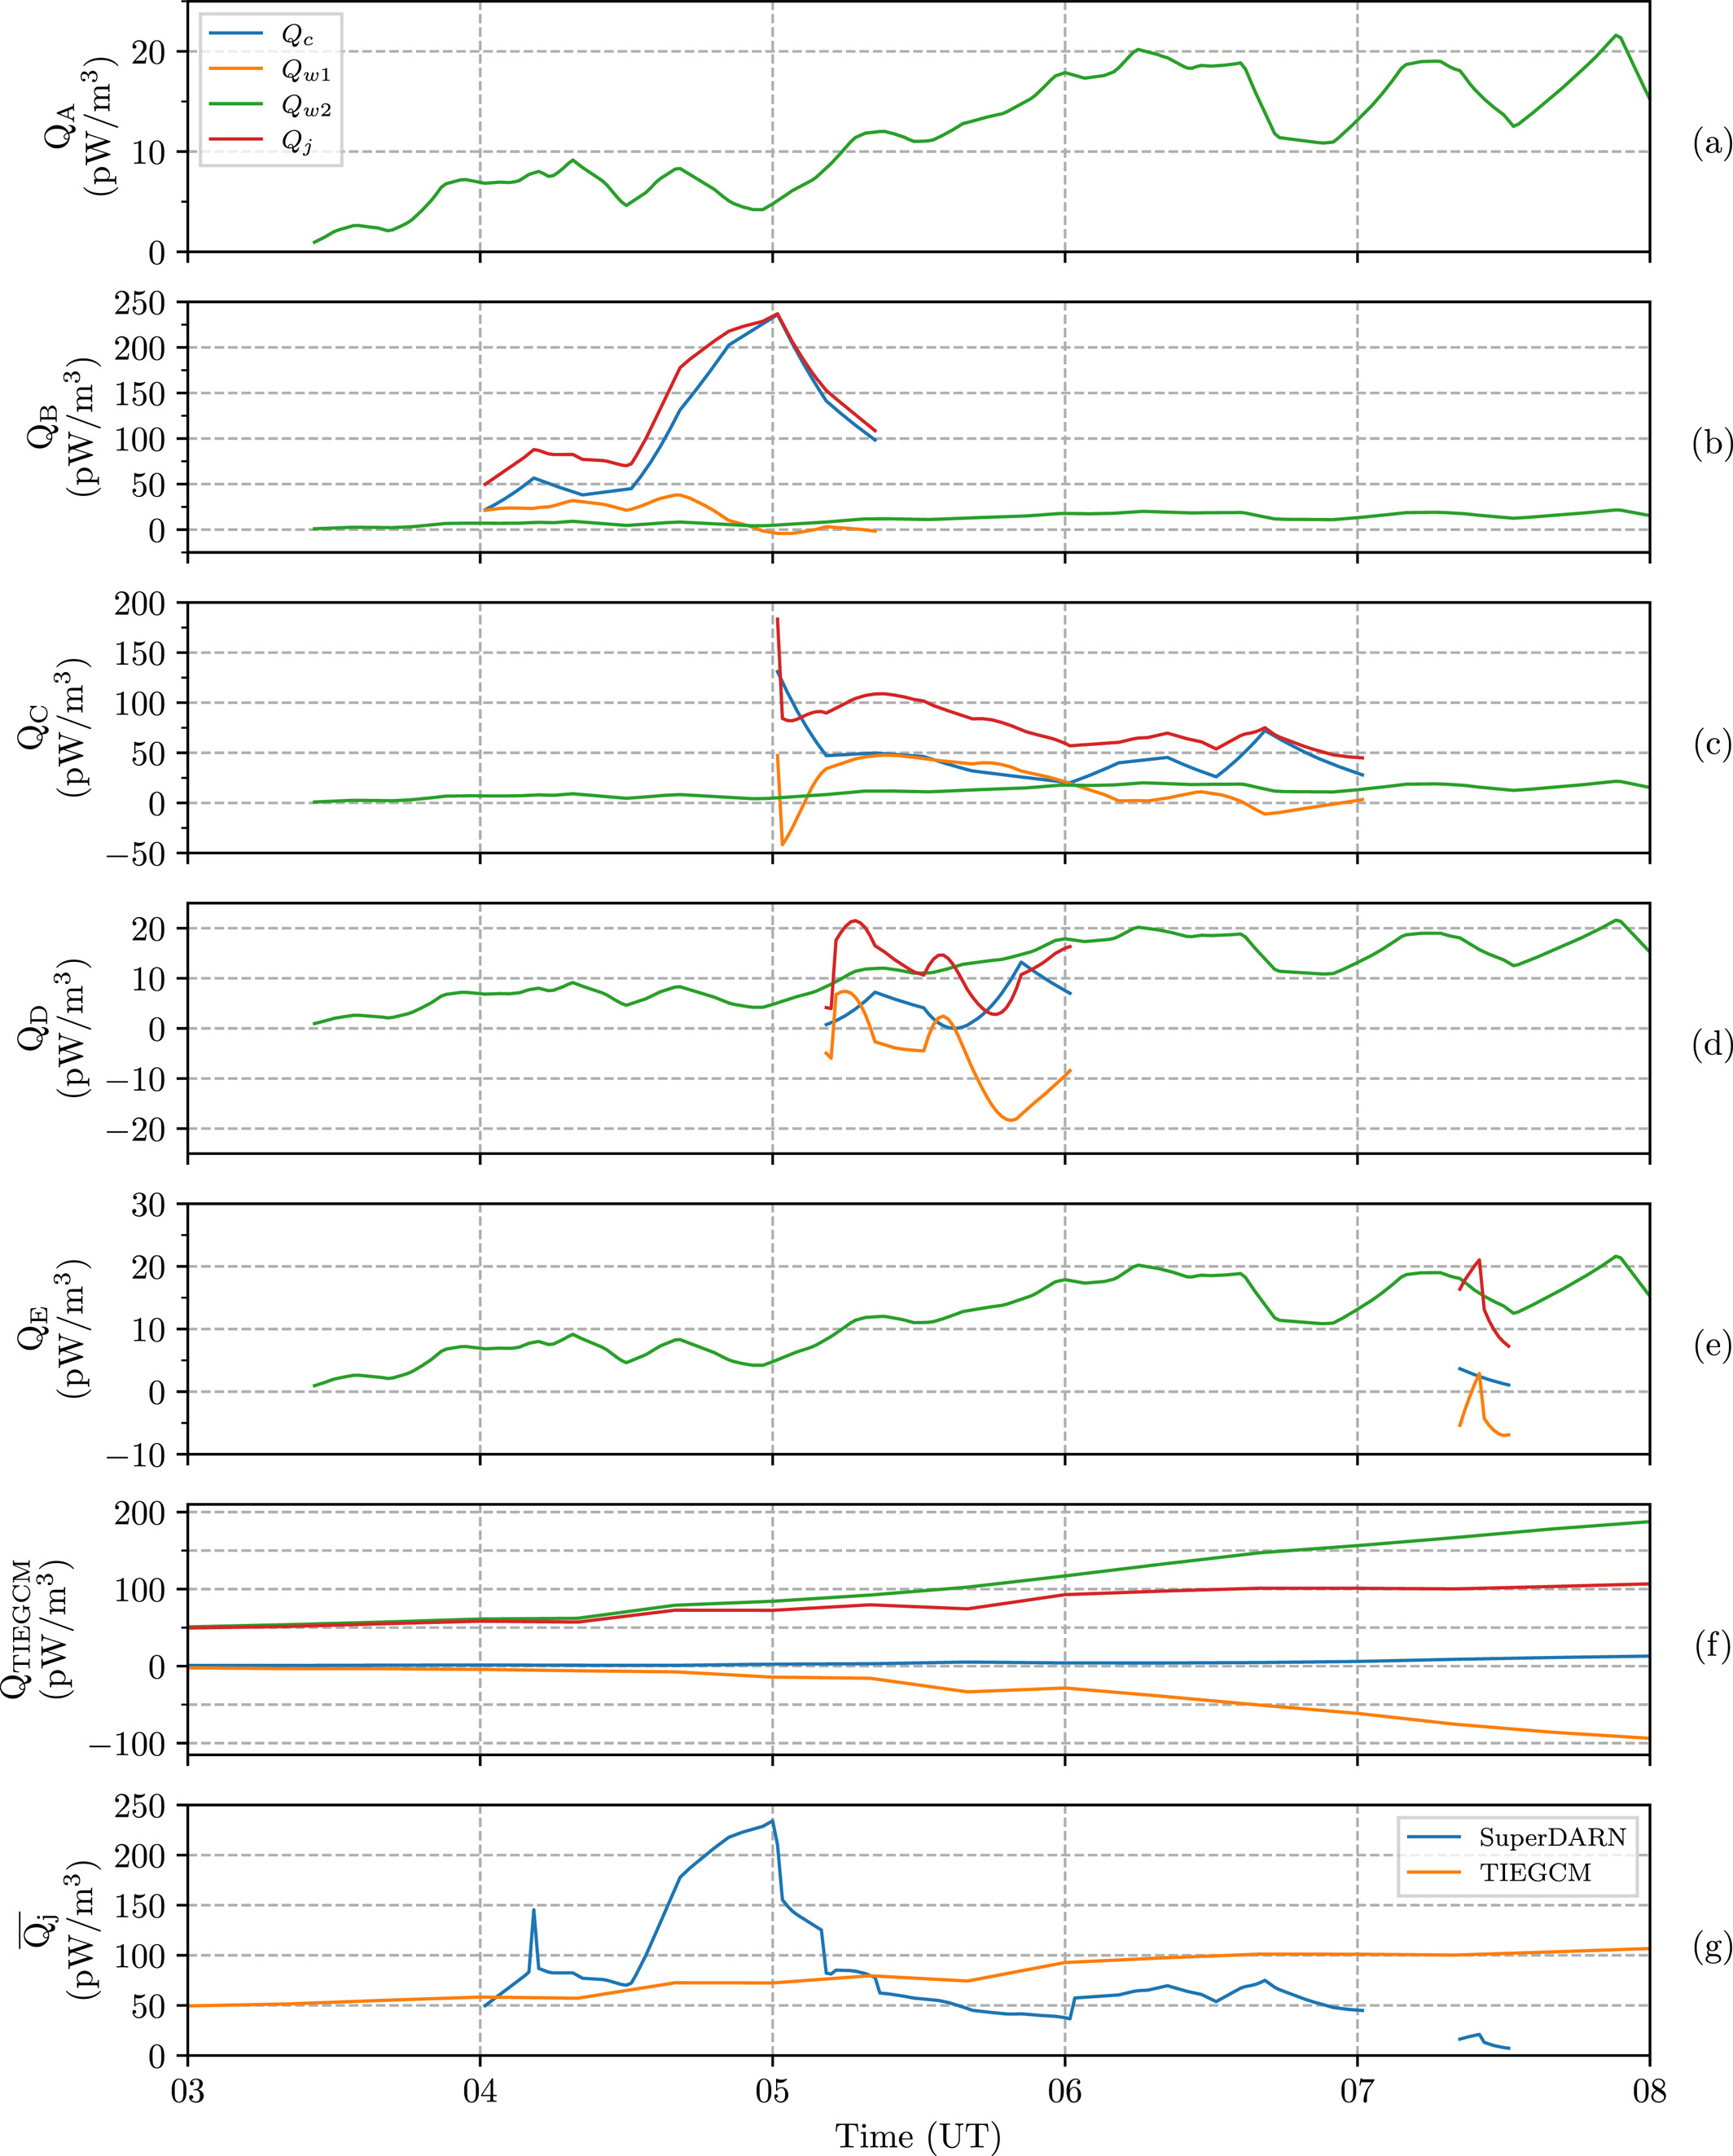
Joule heating is a major energy sink in the solar wind-magnetosphere-ionosphere system and modeling it is key to understanding the impact of space weather on the neutral atmosphere. Ion drifts and neutral wind velocities are key parameters when modeling Joule heating, however there is limited validation of the modeled ion and neutral velocities at mid-latitudes. We use the Blackstone Super Dual Auroral Radar Network radar and the Michigan North American Thermosphere Ionosphere Observing Network Fabry-Perot interferometer to obtain the local nightside ion and neutral velocities at ∼40° geographic latitude during the nighttime of 16 July 2014. Despite being a geomagnetically quiet period, we observe significant sub-auroral ion flows in excess of 200 ms−1. We calculate an enhancement to the local Joule heating rate due to these ion flows and find that the neutrals impart a significant increase or decrease to the total Joule heating rate of >75% depending on their direction. As is shown in the figure. Different patches in the ionosphere move at different speeds and therefore create varying Joule heating rates. We compare our observations to outputs from the Thermosphere Ionosphere Electrodynamic General Circulation Model (TIEGCM). At such a low geomagnetic activity however, TIEGCM was not able to model significant sub-auroral ion flows and any resulting Joule heating enhancements equivalent to our observations. We found that the neutral winds were the primary contributor to the Joule heating rates modeled by TIEGCM rather than the ions as suggested by our observations. This presents a gap in TIEGCM's capabilities and care has to be taken when estimating Joule heating rates from models, which make assumptions about ionospheric flows at mid-latitudes.

Panels a, b, c, d and e shows the estimated Joule heating components and total heating for each identified patch of
ionospheric flow, the panel labels correspond to the different patch velocities in the paper.
Each component is plotted according to the legend in panel a.
Panel f shows the Joule heating components and total heating modeled by TIEGCM.
Panel g shows the total Joule heating rate calculated as the average heating rate of all patches in the common area,
while re-plotting TIEGCM's total Joule heating in orange for comparison.
See publication for details:
Day, E. K., Grocott, A., Walach, M.-T., Wild, J. A., Lu, G., Ruohoniemi, J. M., & Coster, A. J. (2024). Observation of quiet-time mid-latitude Joule heating and comparisons with the TIEGCM simulation. Journal of Geophysical Research: Space Physics, 129, e2024JA032578. https://doi.org/10.1029/2024JA032578
