MIST
Magnetosphere, Ionosphere and Solar-Terrestrial
On the Association of Substorm Identification Methods
By Christian Lao (UCL, Mullard Space Science Laboratory)
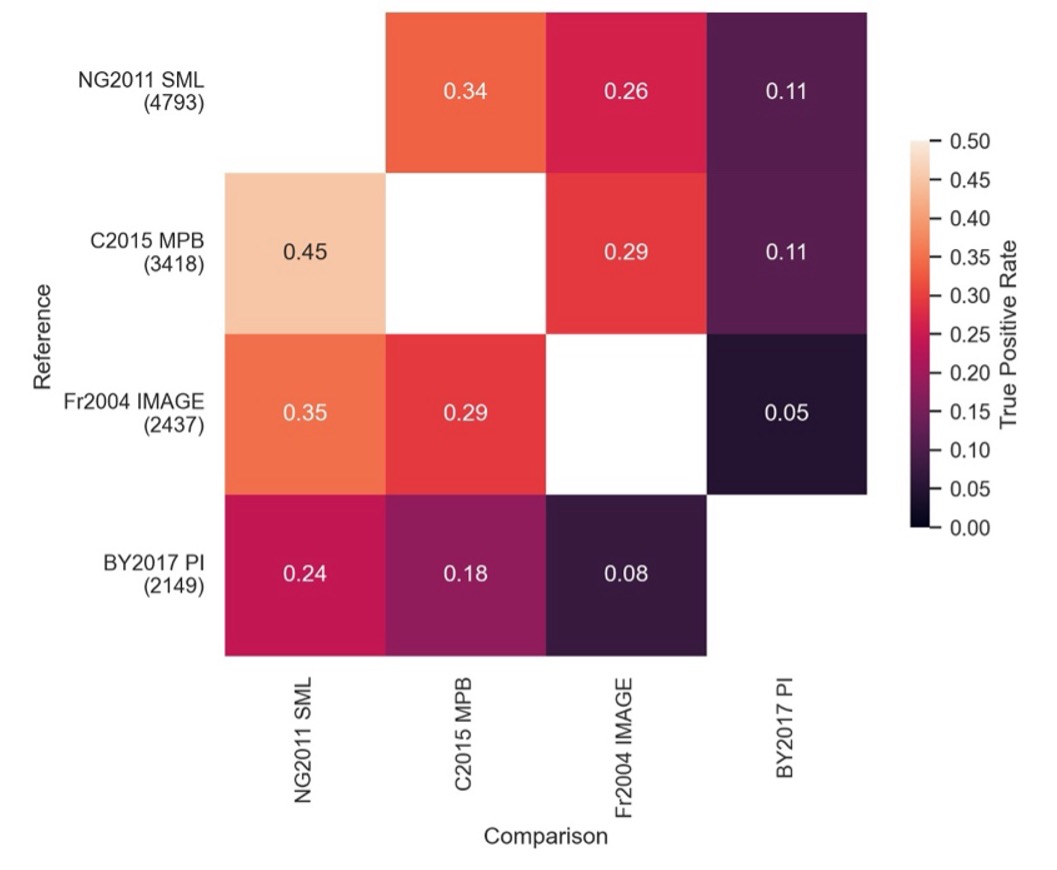
Substorms are a major energy unloading process in the solar wind-magnetosphere-ionosphere system that are capable of processing approximately 10^15J of stored solar wind energy through a complete cycle (Tanskanen et al., 2002). In broad terms, energy is built up and stored in the magnetosphere during substorm growth phases by enhanced reconnection between the solar wind and the magnetosphere on the dayside. Energy is released during substorm expansion and recovery phases by reconnection and other plasma instabilities in the magnetotail, with the start of the expansion phase known as substorm onset. Over the years, numerous signatures and techniques have been used to identify substorm onsets, but these are typically developed or used in isolation. In this study, we quantify the association between the different signatures used for identification of substorms (more specifically, substorm onset). Generally, we found that methods developed and applied to ground magnetometer data achieved the best associations, with events identified at mid-latitude (Chu et al., 2015) and at auroral latitudes (Newell & Gjerloev, 2011) showing the highest levels of coincidence with other substorm indicators. On the other hand, we found that events identified by particle injections (Borovsky & Yakymenko, 2017) showed much poorer associations with other substorm lists, in particular with no improvement over chance agreement with events identified from the aurora. Remarkably, we found less than 50% agreement on the timing and occurrence of substorms between any of the lists studied. As such, any studies dependent upon such lists may come to premature conclusions about substorm dynamics or impacts. Furthermore, a significant number of events in each list may not share multiple substorm signatures, calling into question the legitimacy of each identification. This highlights the need to further cross calibrate our methods or use multiple signatures to evaluate a more robust set of events.

True positive rate “heatmap” showing the percentage of events from the Reference (Horizontally labelled)
substorm list a Comparison substorm list (Vertically labelled) also observes. These are the best
performing methods on the datasets they are leveraging. A higher score/lighter colour indicates better association.
References:
Tanskanen et al. 2002: https://doi.org/10.1029/2001JA900153
Chu et al., 2015: https://doi.org/10.1002/2015JA021104
Newell & Gjerloev, 2011: https://doi.org/10.1029/2011JA016779
Borovsky & Yakymenko, 2017: https://doi.org/10.1002/2016JA023625
See publication for details:
Lao, C. J., Forsyth, C., Freeman, M. P., Smith, A. W., & Mooney, M. K. (2024). On the association of substorm identification methods. Journal of Geophysical Research: Space Physics, 129, e2024JA032762. https://doi.org/10.1029/2024JA032762
