MIST
Magnetosphere, Ionosphere and Solar-Terrestrial
Transpolar Arcs: Seasonal Dependence Identified by an Automated Detection Algorithm
By Gemma E Bower (University of Leicester)
Transpolar arcs (TPAs) are primarily a northward IMF auroral phenomena. They consist of an arc of auroral emission poleward of the main auroral oval. Their presence suggests that the magnetosphere has a complicated magnetic topology. Currently, TPA formation and evolution have no single explanation that is unanimously agreed upon.
In order to further study the occurrence of TPAs we have developed an automated detection algorithm to determine the occurrence of TPAs in UV images captured by the Defense Meteorological Satellite Program/ Special Sensor Ultraviolet Spectrographic Imager (DMSP/SSUSI) from spacecraft F16, F17, and F18. The detection algorithm identified TPAs as a peak in the average radiance intensity poleward of 12.5° colatitude, in two or more of the wavelengths/bands sensed by SSUSI.
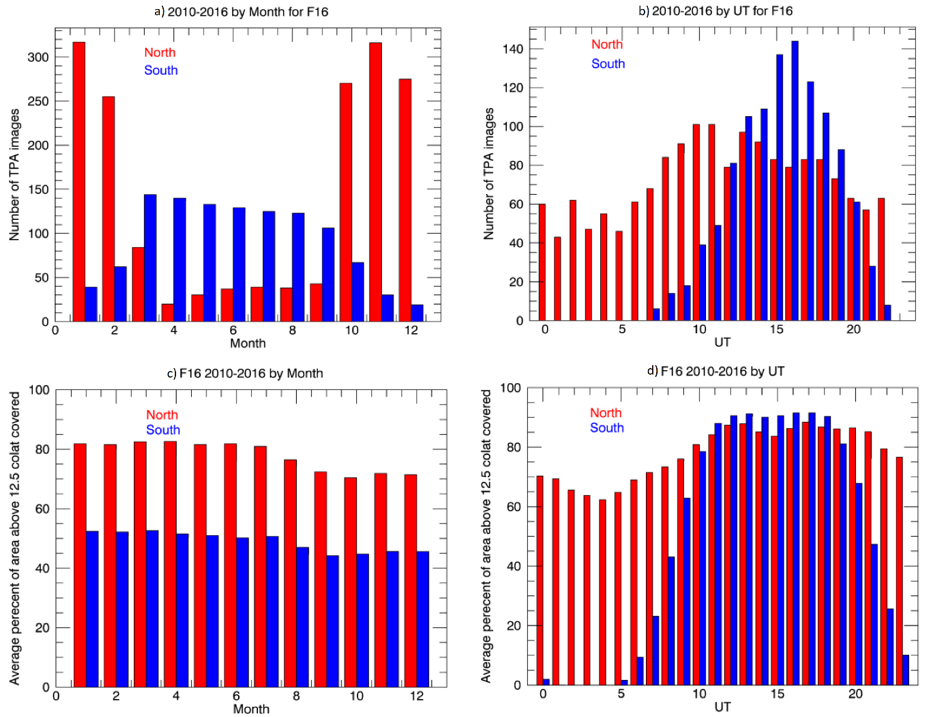
Over 5,000 SSUSI images containing TPAs were identified by the detection algorithm between the years 2010 to 2016. Figure 1a and b shows the seasonal and UT distribution for the F16 TPA images respectively. The occurrence of these TPA images shows a seasonal dependence, with more arcs being visible in the winter hemisphere. There is also an apparent dependence on time-of-day, especially in the southern hemisphere where no TPAs are seen between 23 and 06 UT.
We investigated the effect that the orbital plane of DMSP has on the area of the detection window scanned, as a possible explanation of the dependences in the results of the detection algorithm. Figure 1c and 1d show the results for F16 for seasonal and UT distribution respectively. It can be seen that the orbital plane of DMSP leads to a preferential observation of the northern hemisphere, and the detection algorithm missing TPAs in the southern hemisphere around 01–06 UT. Hence, we conclude that there is no dependence of TPA occurrence on UT. No seasonal bias in the observations is found, indicating that the seasonal dependence of the TPA occurrence is real. We discuss the ramifications of these findings in terms of proposed TPA generation mechanisms.

Figure 1: (a-b) Number of transpolar arc (TPA) images identified by F16 between 2010 and 2016. (c-d) Average percent of the detection window poleward of 12.5° colatitude scanned by F16 between 2010 and 2016. (a and c) By month. (b and d) By UT. The northern hemisphere is red and the southern hemisphere is blue
Please see paper for full details: Bower, G. E., Milan, S. E., Paxton, L. J., & Imber, S. M. (2022). Transpolar arcs: Seasonal dependence identified by an automated detection algorithm. Journal of Geophysical Research: Space Physics, 127, e2021JA029743. https://doi.org/10.1029/2021JA029743
