MIST
Magnetosphere, Ionosphere and Solar-Terrestrial
Nuggets of MIST science, summarising recent papers from the UK MIST community in a bitesize format.
If you would like to submit a nugget, please fill in the following form: https://forms.gle/Pn3mL73kHLn4VEZ66 and we will arrange a slot for you in the schedule. Nuggets should be 100–300 words long and include a figure/animation. Please get in touch!
If you have any issues with the form, please contact This email address is being protected from spambots. You need JavaScript enabled to view it..
The Nonlinear Evolution of Whistler-Mode Chorus waves: How Modulation Instabilities Can Be a Route to Tone Formation
By Daniel Ratliff (Northumbria University)
Whistler-Mode Chorus (WMC) waves remain a key contributor to the processes underpinning space weather modelling and have garnered considerable interest for their unique frequency properties (known as tones, where the frequency will rise or fall coherently). This role and phenomena are in no small part due to the interplay between these waves and the electrons present in the magnetosphere. At present, these wave particle interactions are difficult to model simultaneously effectively, and we normally restrict ourselves to the effect of one on the other – either a known wave is used to develop a particle distribution, or a supplied particle distribution generates WMC waves. Can we develop models that do both? And furthermore, can we develop a model that can reproduce this interesting set of frequency dynamics?
In our paper, we use formal perturbation techniques to derive a reduced, nonlinear model for (parallel propagating) WMC that is driven by wave-particle interactions via ponderomotive effects. Our first attempt, the famous Nonlinear Schrodinger equation, fails to generate tones – and so we dig a little deeper to find a term responsive for nonlinear frequency shifts. Surprisingly, this new term responsible for tones vanishes precisely at the WMC band gap at half the electron gyrofrequency, and provides a theoretical basis for why such a bandgap exists. By exploring this model numerically, we also find that there are cases where this tonal behaviour comes with a significant enhancement of the electron kinetic energy – so maybe the magnetosphere’s dawn chorus is at times a swan song in disguise?
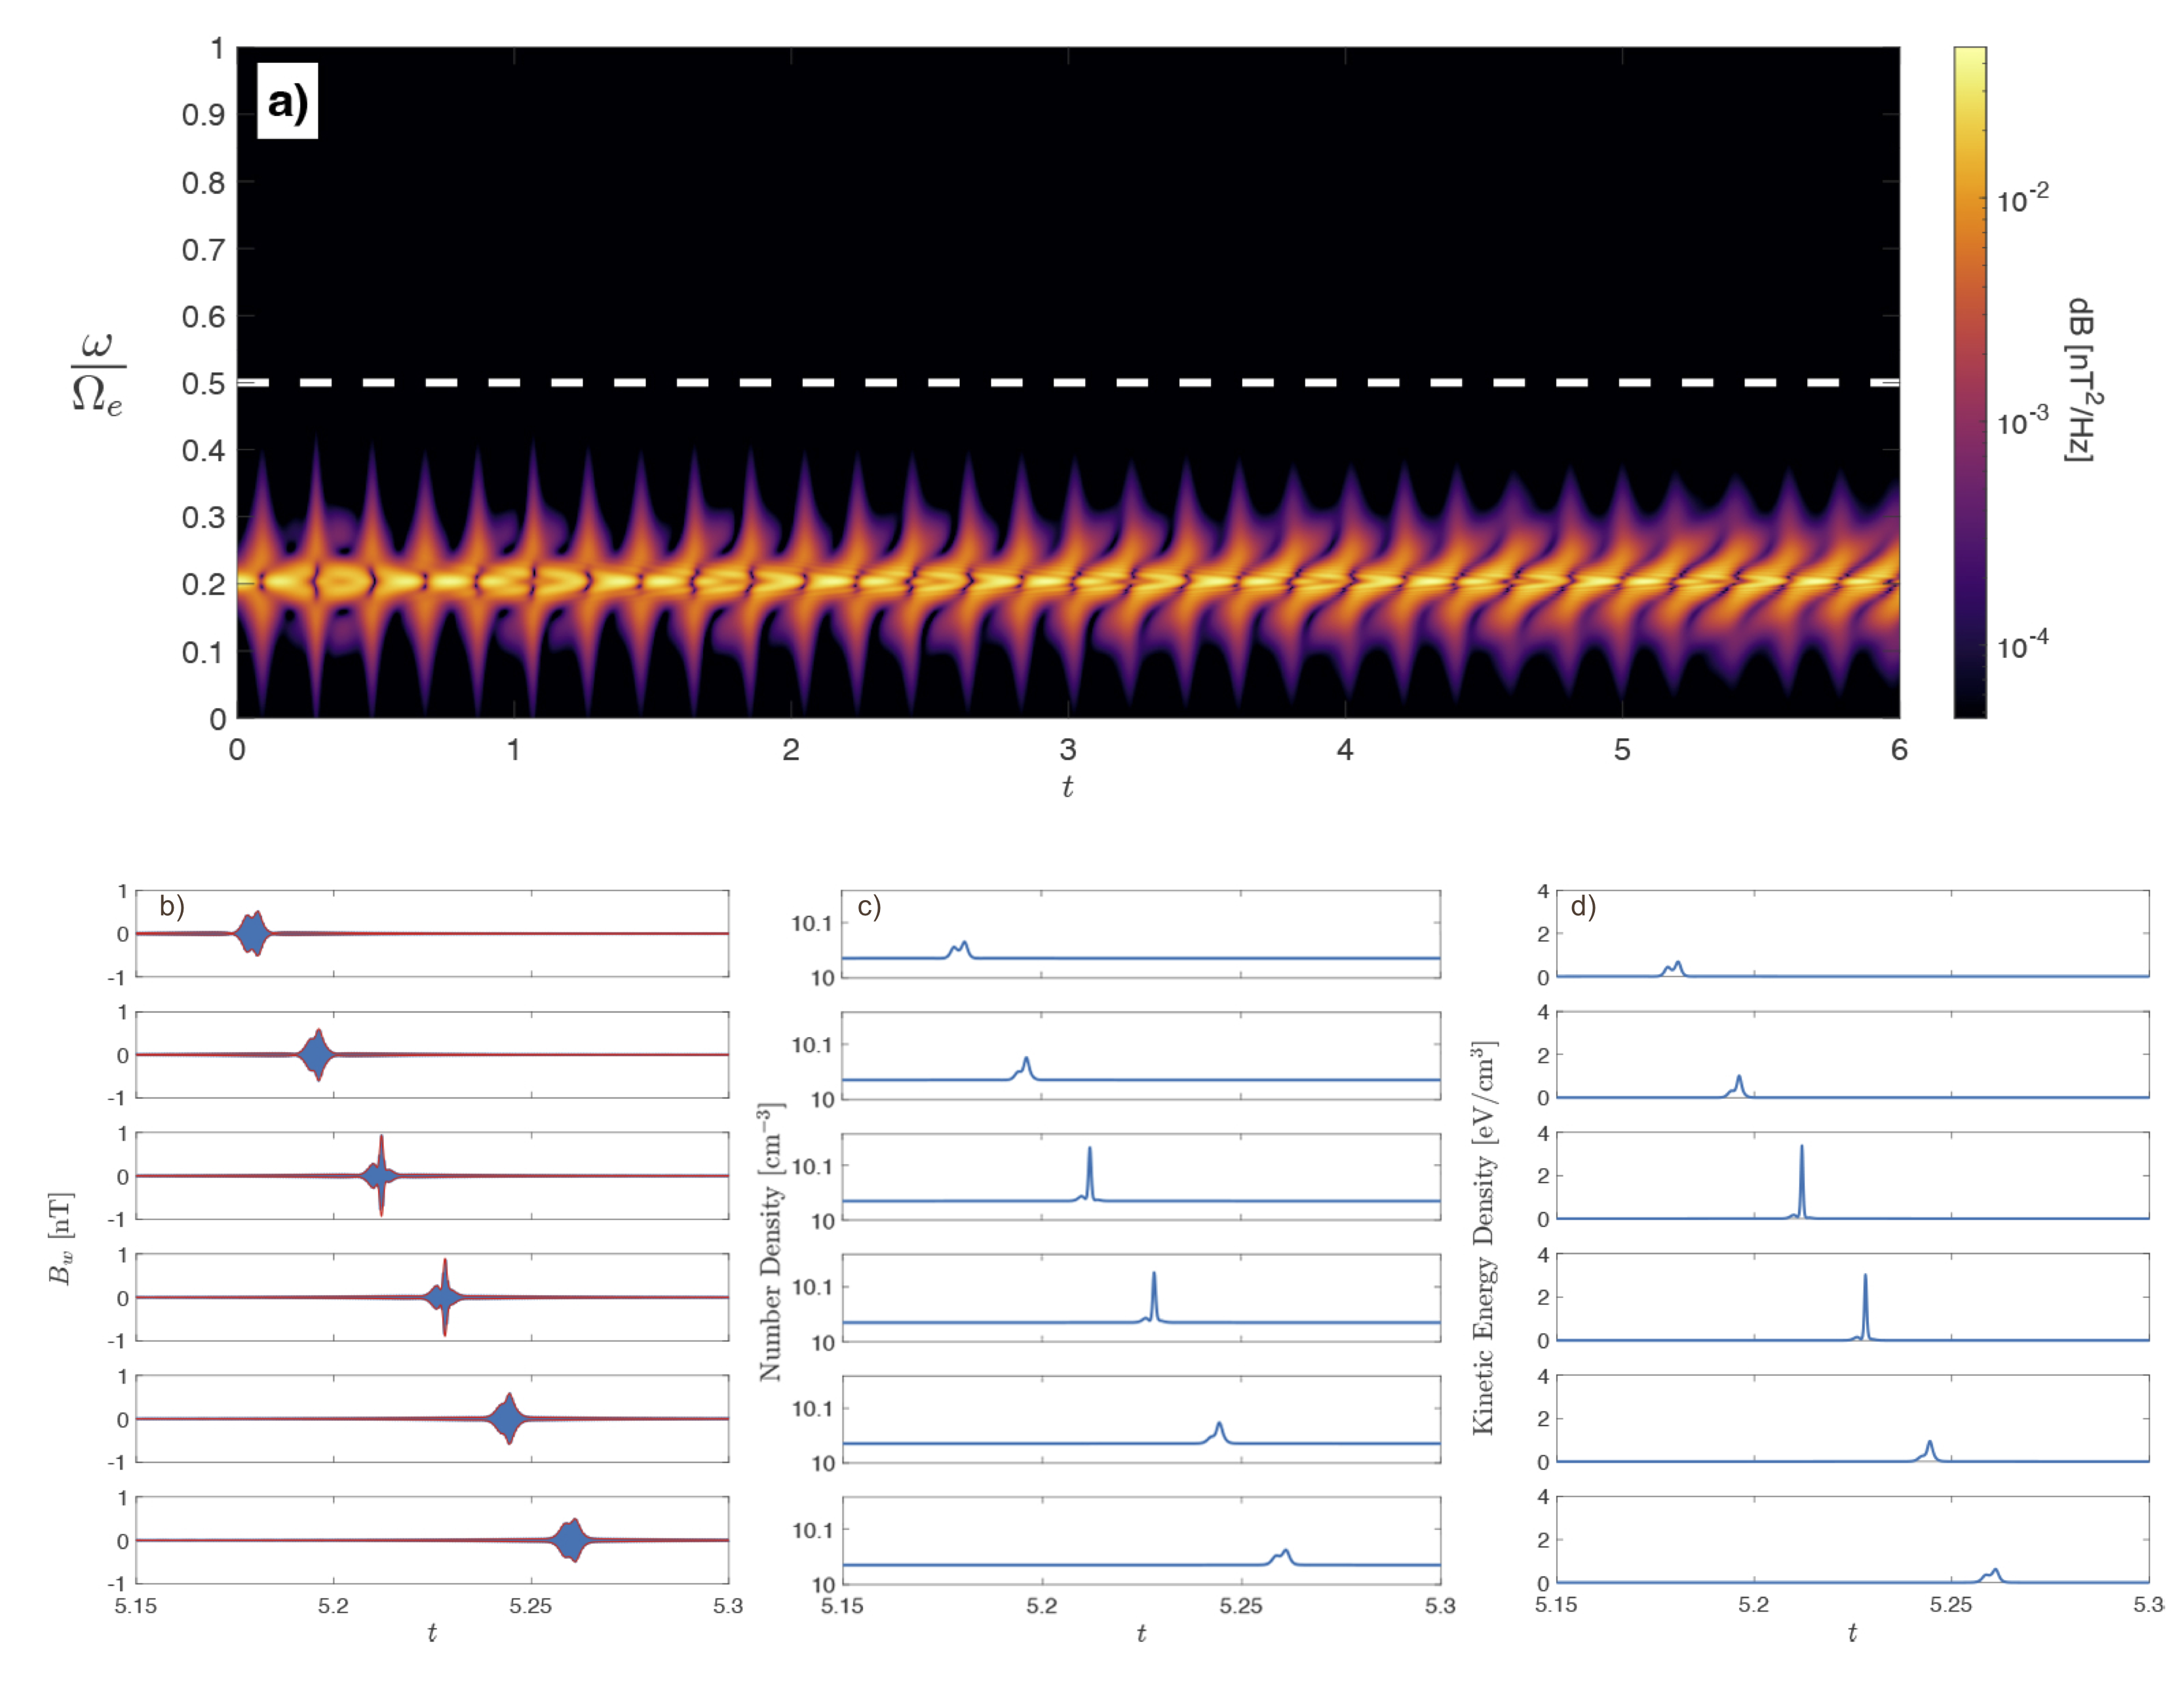
See publication for further information:
Ratliff DJ, Allanson O. The nonlinear evolution of whistler-mode chorus: modulation instability as the source of tones. Journal of Plasma Physics. 2023;89(6):905890607. doi:10.1017/S0022377823001265
Modeling and Observations of the Effects of the Alfvén Velocity Profile on the Ionospheric Alfvén Resonator
By Rosie Hodnett (University of Leicester)
The Ionospheric Alfvén Resonator (IAR) occurs when Alfvén waves partially reflect from boundaries in the ionosphere, towards the bottom of the ionosphere and above the F-region peak. The frequencies of the IAR are strongly controlled by the plasma mass density in the ionosphere, which is not uniform.
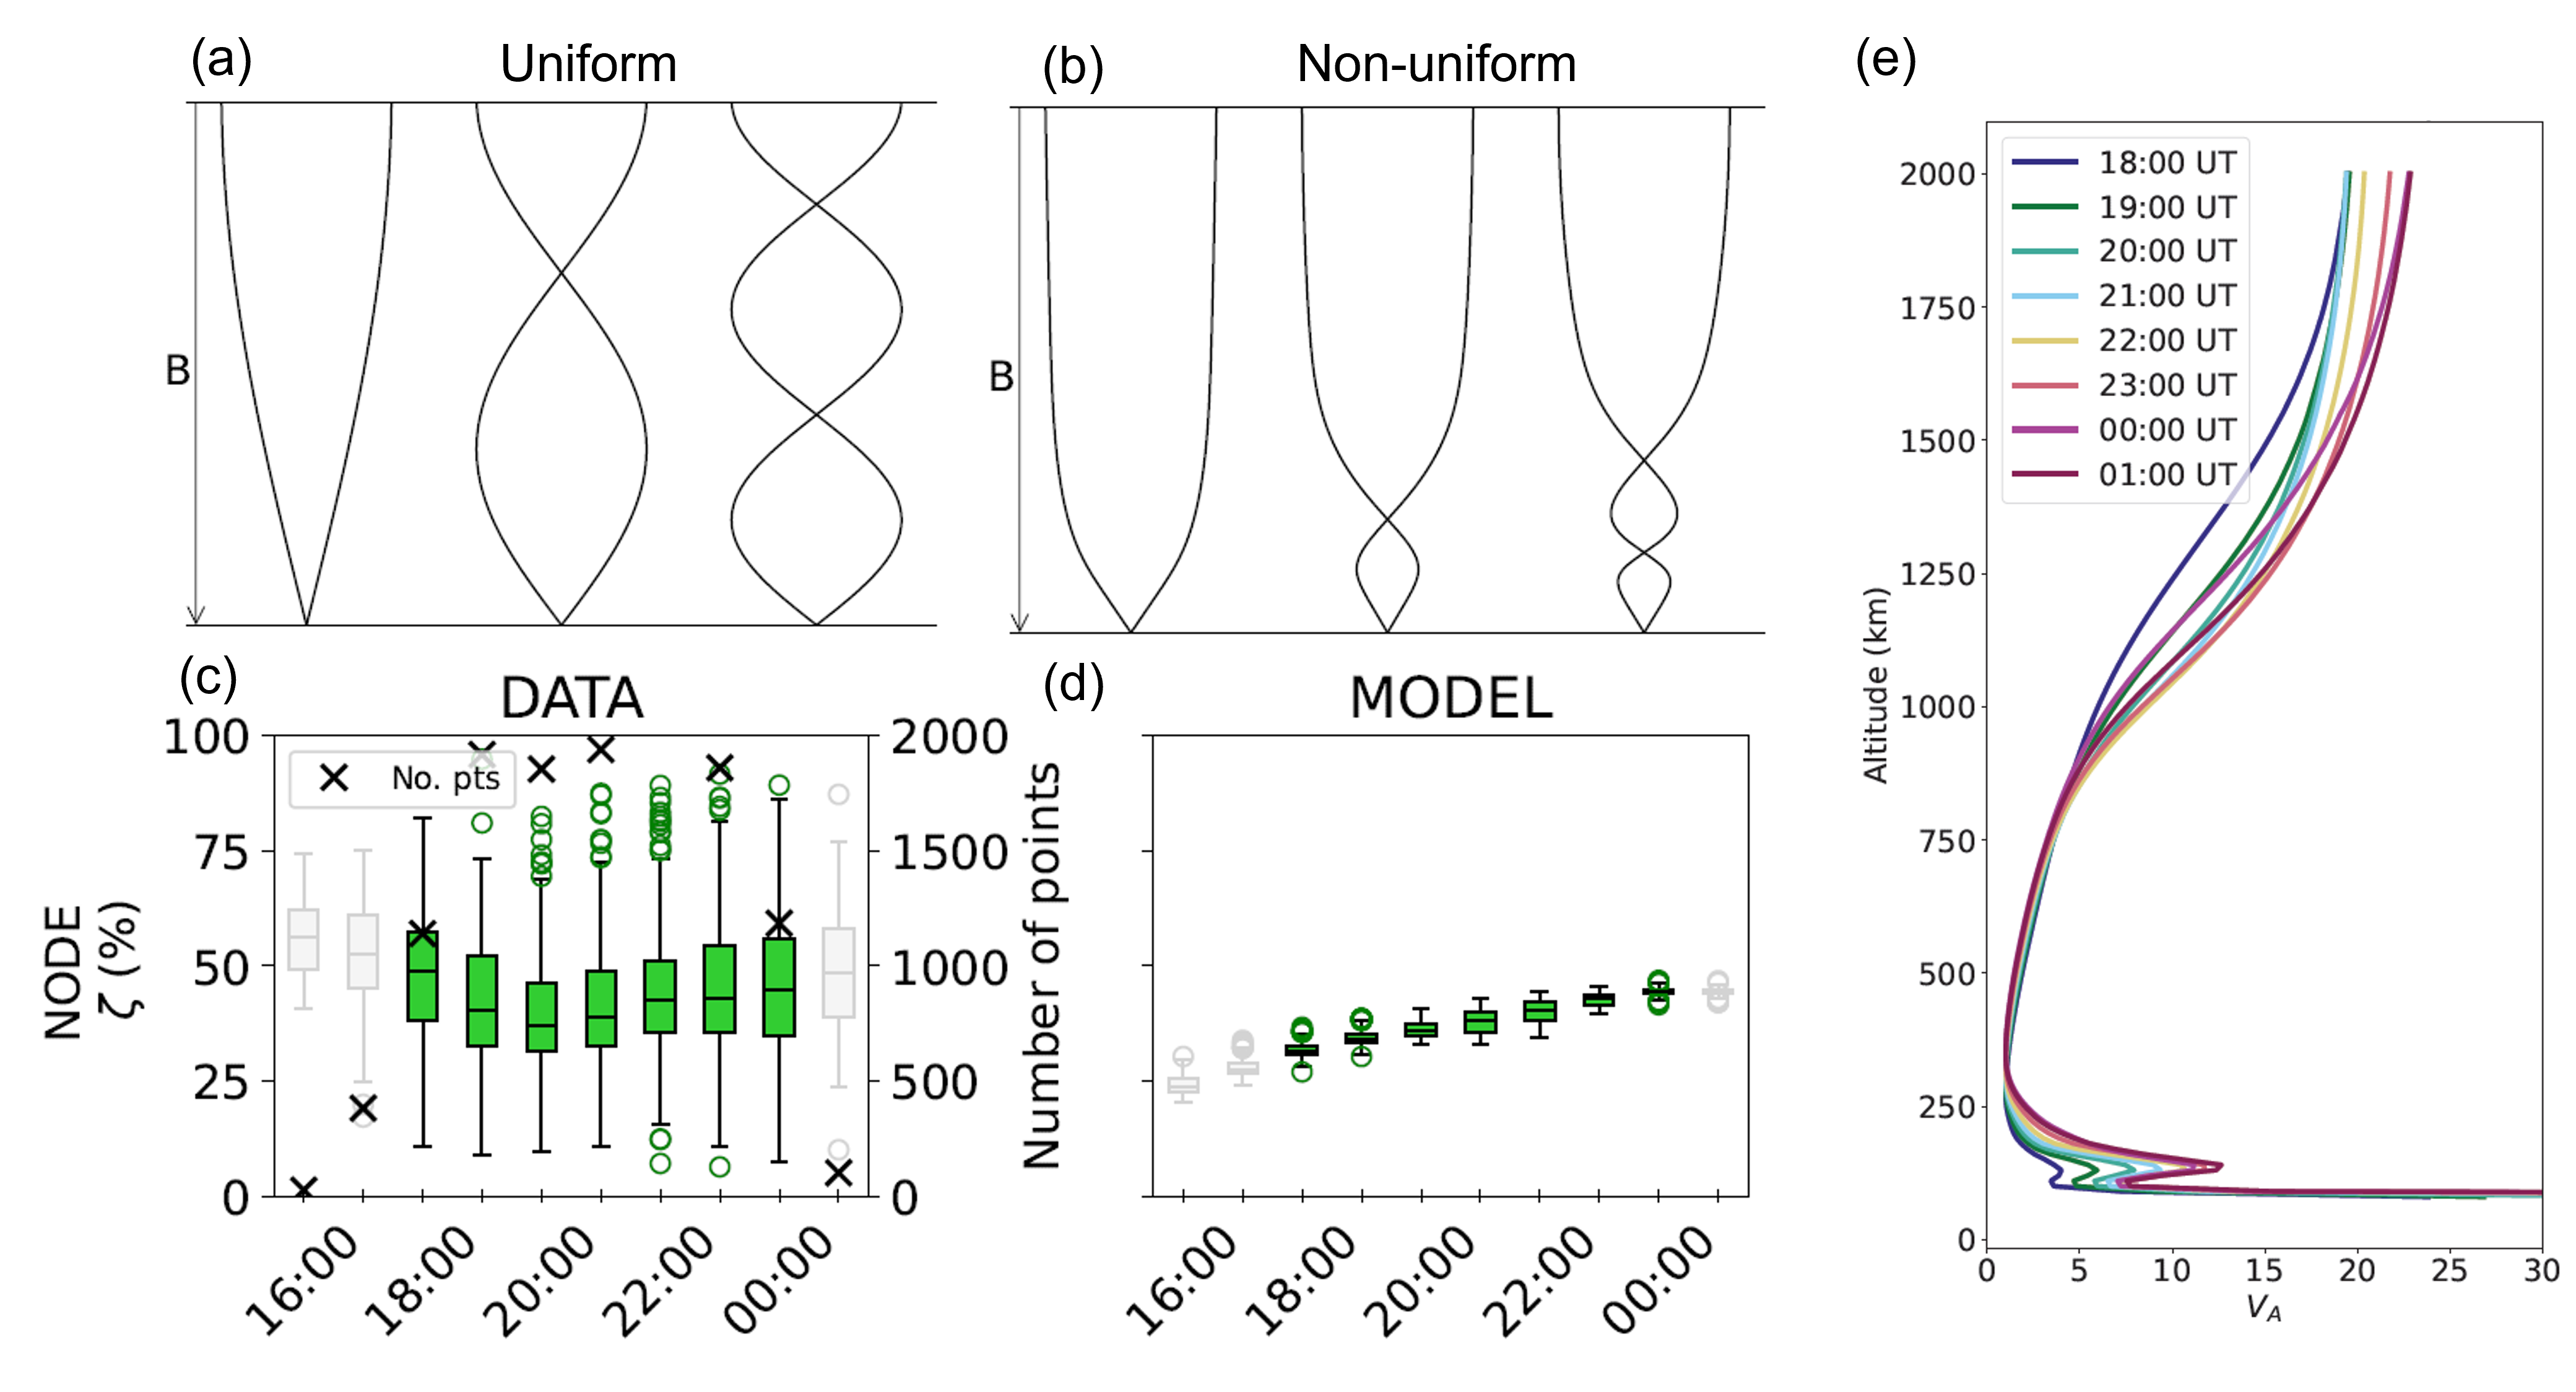
We have observed IAR in induction coil magnetometer data at Eskdalemuir, UK (BGS site), and extracted the harmonic frequencies for nine years of data. To model the harmonic frequencies, we used the International Reference Ionosphere and the International Geomagnetic Reference Field to model Alfvén velocity profiles. By solving a one-dimensional wave equation, we modelled the first five harmonics of the IAR for times where we had data. The wave structure of the electric field for a uniform case is shown in panel (a), and the resulting modelled harmonics for a non-uniform case is shown in panel (b). We modelled the frequencies with the lower boundary condition of the electric field of the wave being a node (shown in the figure below) and an antinode. By looking at the percentage difference between the fundamental frequency and the average separation of the harmonics (ζ) for both the node and antinode models and comparing this with the data, we find that the lower boundary is closest to being a node. ζ is presented for the node case, with UT, in panels (c) and (d), which show the data and the model respectively, binned by UT. The trend of increasing ζ towards midnight is due to changing Alfvén velocity profiles (shown in panel (e)), and suggests that the ionosphere is becoming more non-uniform. As such, measurements of IAR could be used to gain insight into the shape of the Alfvén velocity profile of the ionosphere.
BGS induction coil magnetometer data, search for 'induction coil': https://webapps.bgs.ac.uk/services/ngdc/
accessions/index.html
See publication for further information:
Hodnett, R. M., Yeoman, T. K., Beggan, C. D., & Wright, D. M. (2024). Modeling and observations of the effects of the Alfvén velocity profile on the Ionospheric Alfvén Resonator. Journal of Geophysical Research: Space Physics, 129, e2023JA032308. https://doi.org/10.1029/2023JA032308
Topology of turbulence within collisionless plasma reconnection
Bogdan Hnat (University of Warwick)
Collisionless magnetic reconnection [1] and plasma turbulence [2] are fundamental mechanisms that transfer energy across scales and between electromagnetic fields and particles. Stretched turbulent vortices and thin reconnection current sheets are prime sites of plasma heating and particle acceleration. Magnetic field line topology is central to both these processes.
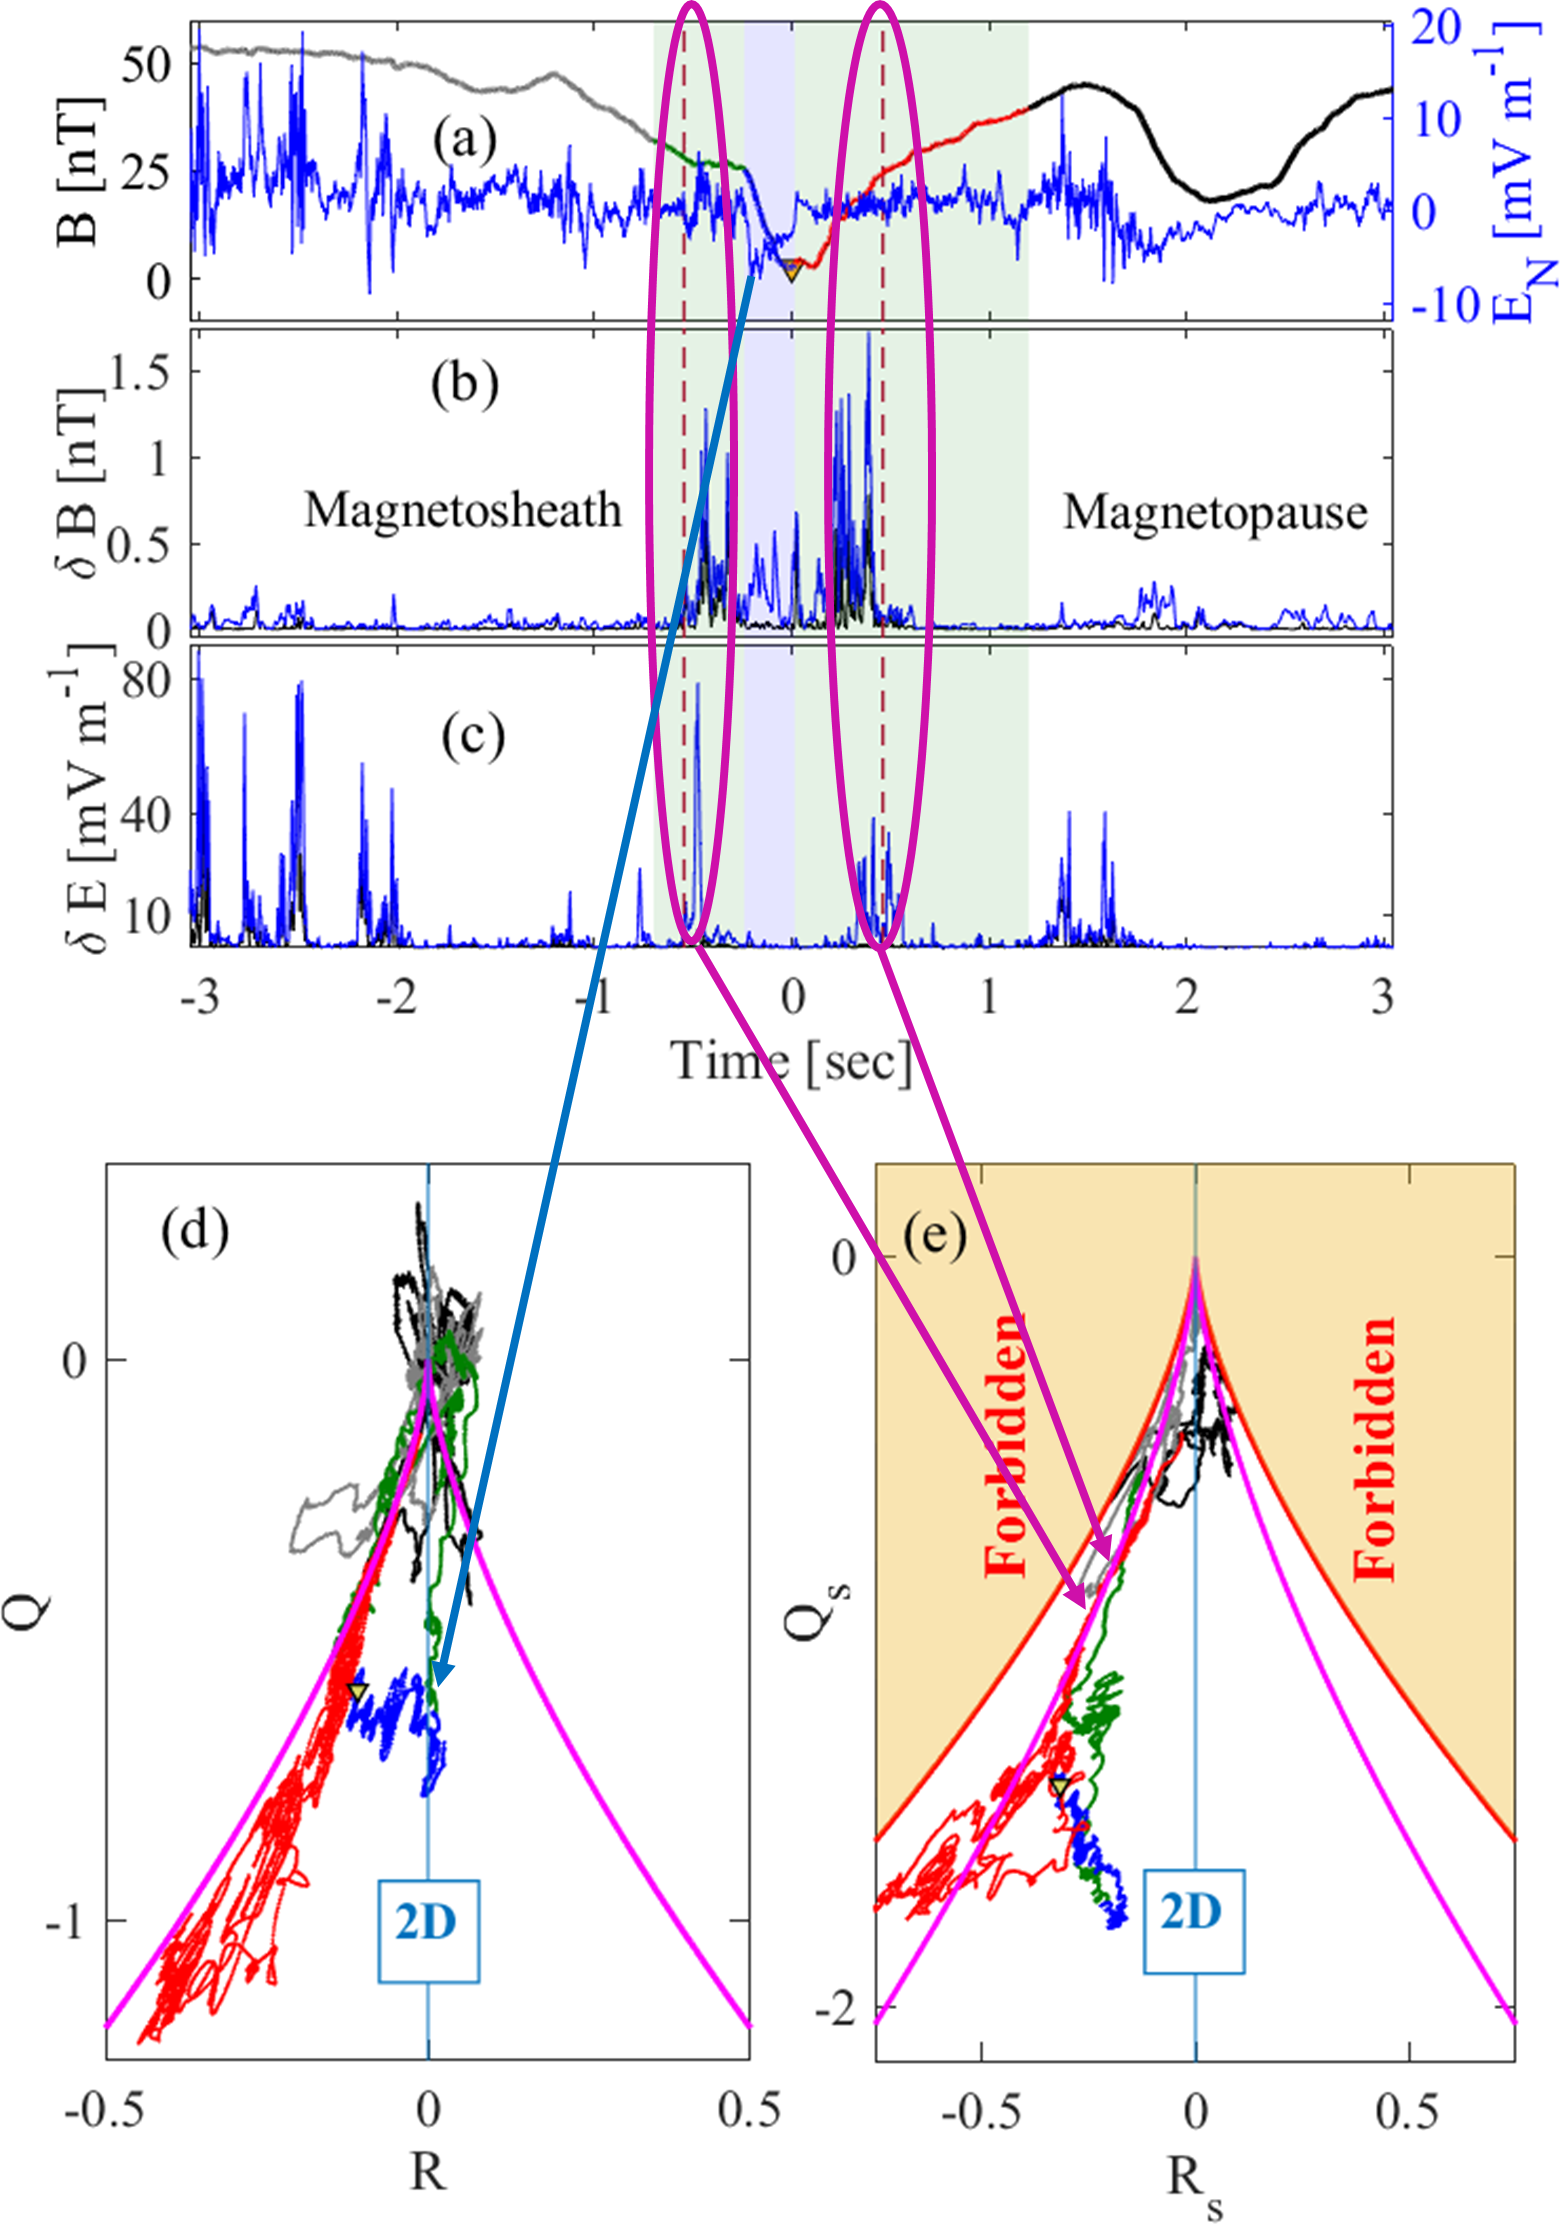
We have classified the magnetic field topology observed as the four MMS spacecraft fly through a well resolved reconnection site. The MMS spacecraft separation defines a spatial 'yardstick', which is of order of the ion inertial range di, for sampling magnetic field topology. However, spatial variation of the topology is indirectly captured on a much finer spatial scale due to high time resolution of the magnetic field measurements, 8192 samples per second.
We find two distinct types of the magnetic field line topology near and at the electron dissipation region (EDR). At the edges of the EDR turbulent-like topology, identical to the topology of stretched vortices in hydrodynamic turbulence, is dominant. It coincides with large high-frequency electromagnetic perturbations. At the EDR the topology departs from turbulence and the structures appear to be two-dimensional, coinciding with suppression of electromagnetic fluctuations. The topology of the magnetic field line directly orders electron acceleration and heating. Suprathermal electrons are absent where turbulent-like topology dominates, but the bulk electron temperature anisotropy is enhanced. Reduced two-dimensional topology at the EDR coincides with the suprathermal electrons. The turbulent-like topology can arise in EMHD in scales smaller than electron inertial scale when vorticity dominates the dynamics. We find that vorticity is indeed dominant at all times within our interval.
References:
[1] J. Birn, E.R. Priest, Reconnection of Magnetic Fields: Magnetohydrodynamics and Collisionless Theory and Observations (Cambridge University Press, New York, 2007).
[2] Matthaeus, W.H. and Velli, M.,Space Science Reviews, 160(1), pp.145-168 (2011).
See publication for further information:
Hnat, Bogdan, Sandra Chapman, and Nicholas Watkins. "Topology of turbulence within collisionless plasma reconnection." Scientific Reports 13.1 (2023): 18665.
Plasma vorticity in the high-latitude ionosphere
By Gareth Chisham (British Antarctic Survey)
Measurements of ionospheric plasma flow vorticity can be used for studying ionospheric plasma transport processes, such as convection and turbulence, over a wide range of spatial scales. This study presents an analysis of probability density functions (PDFs) of ionospheric vorticity for selected regions of the northern hemisphere high-latitude ionosphere as measured by the Super Dual Auroral Radar Network (SuperDARN) over a 6-year interval (2000-2005 inclusive). Making certain assumptions, the observed asymmetric vorticity PDFs can be decomposed into two separate components: (1) A single-sided function that results from the large-scale vorticity inherent in the ionospheric convection pattern, driven by magnetic reconnection; (2) A symmetric double-sided function that results from meso-scale vorticity that derives from fluid processes such as turbulence, and from measurement uncertainties.
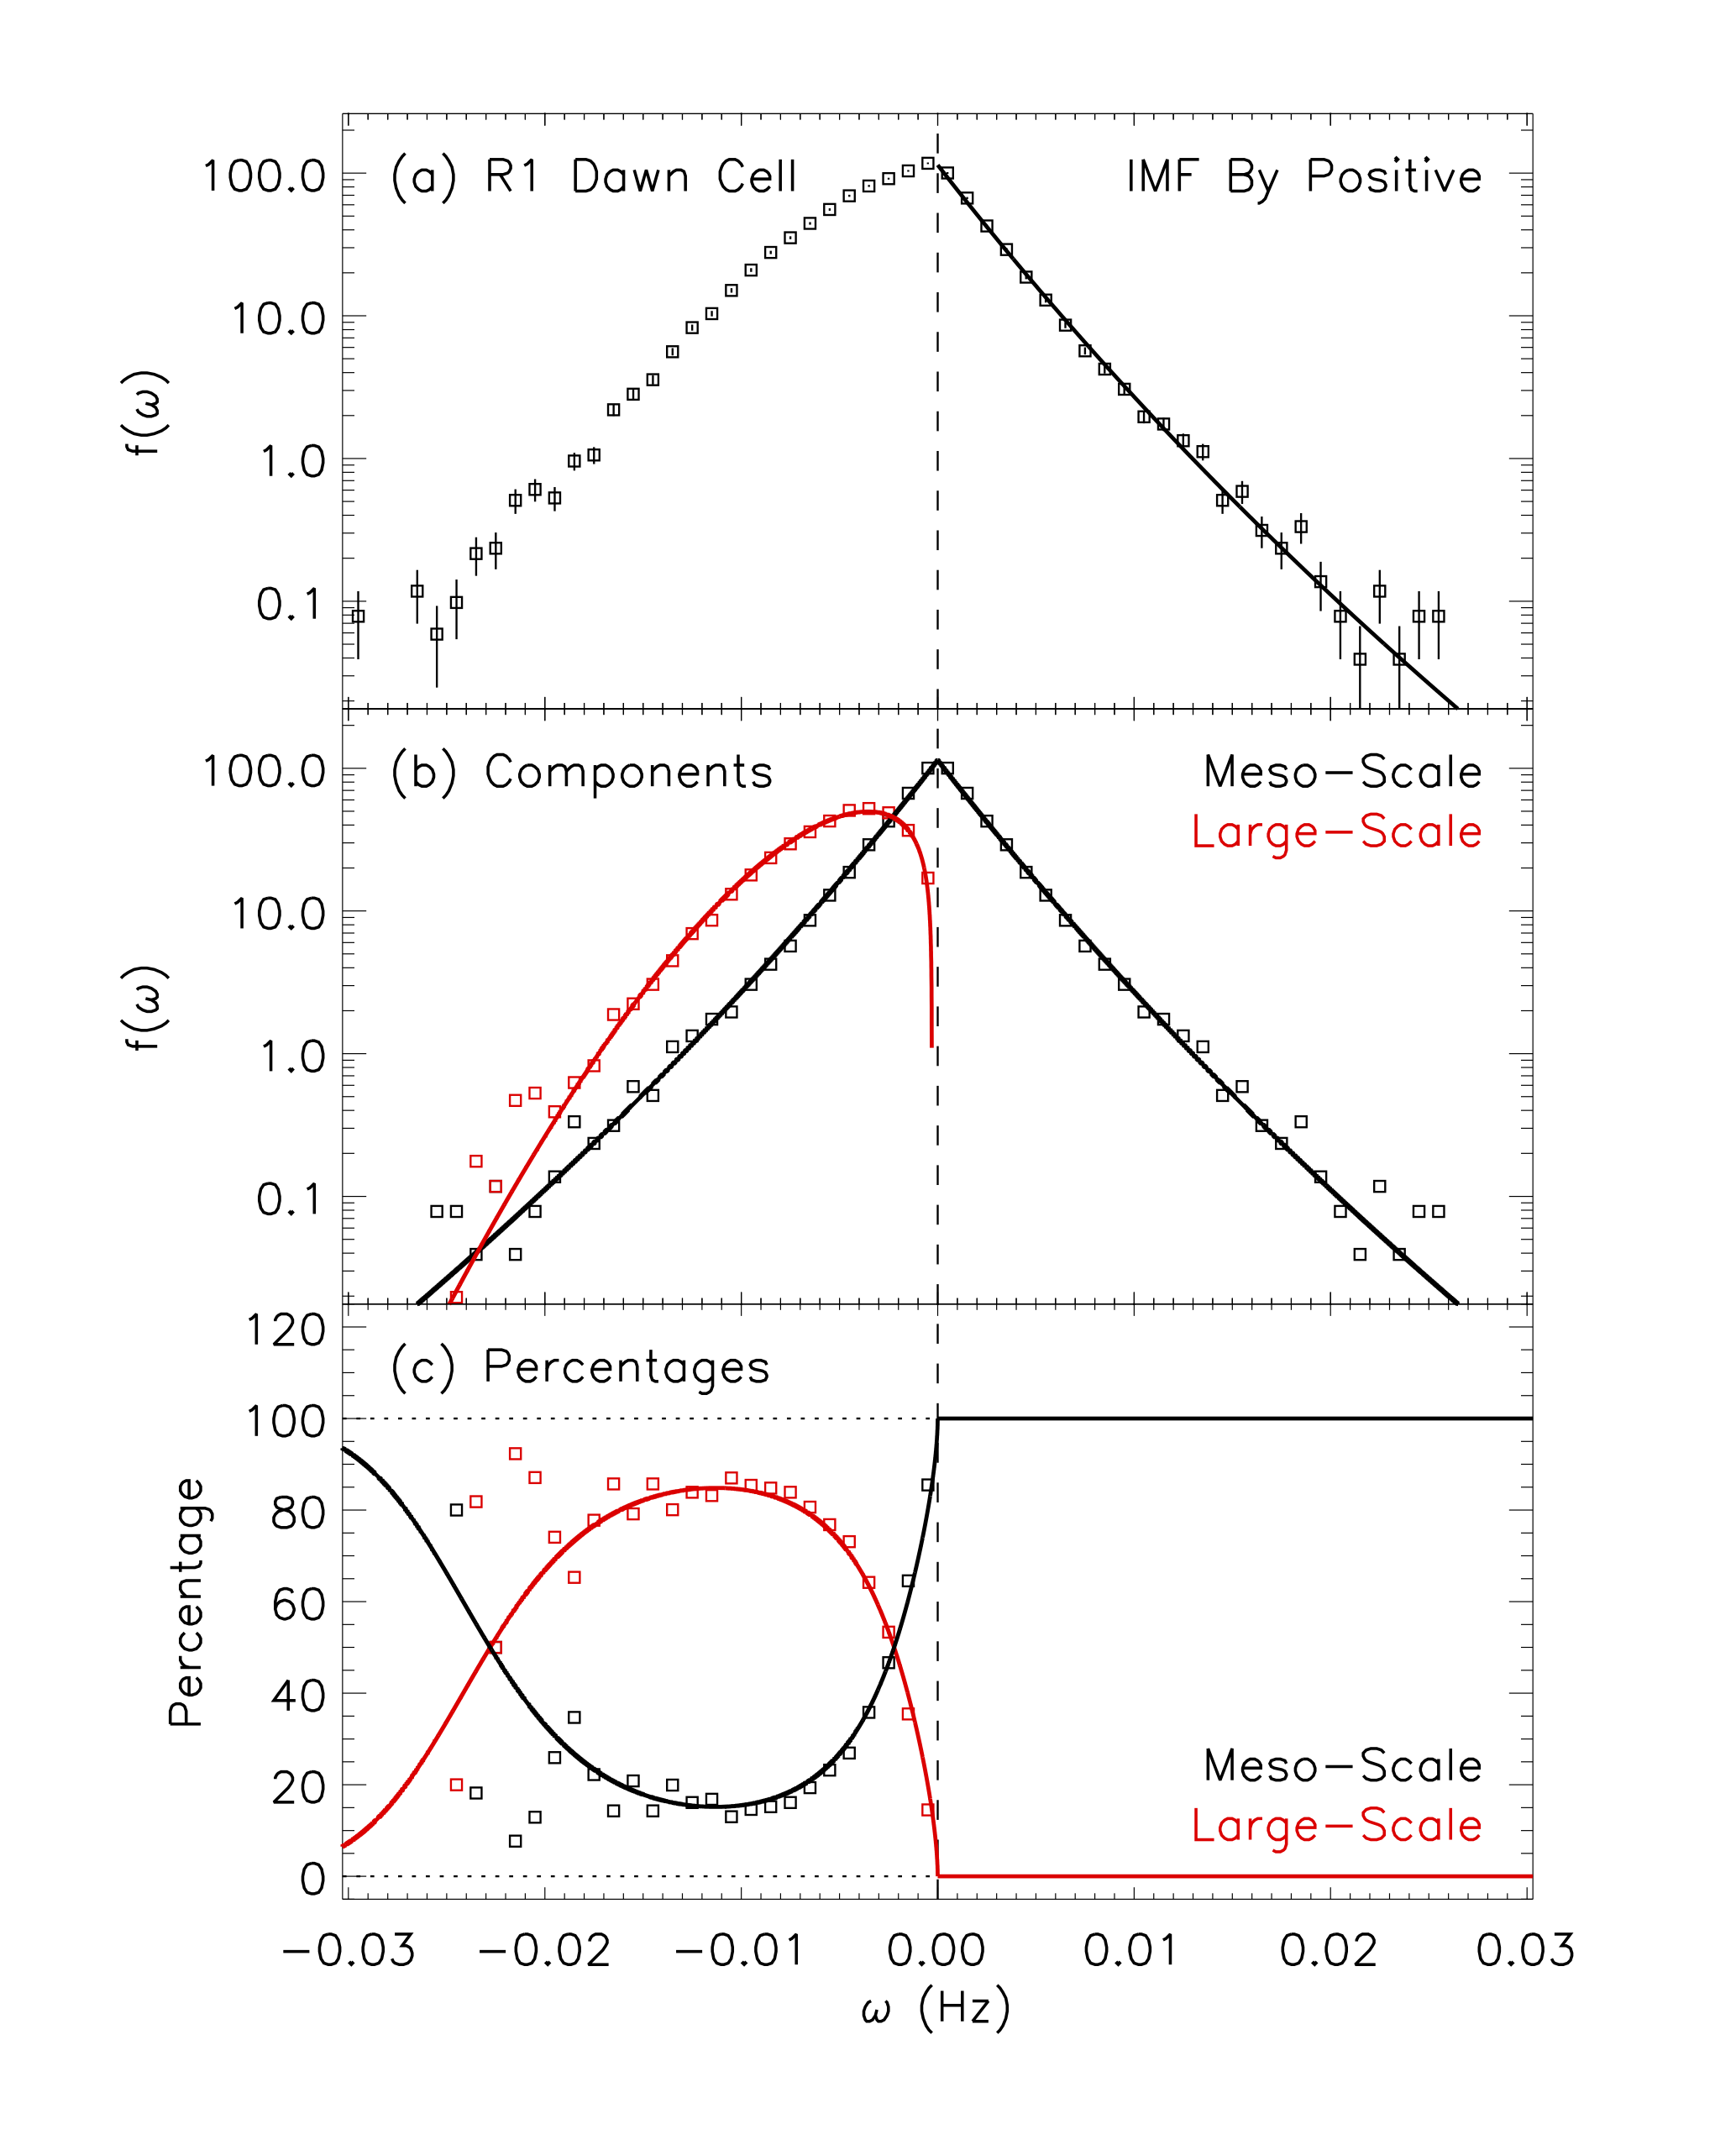
Being able to model ionospheric vorticity in this way will help to improve models of ionospheric plasma flow that are often used in larger-scale system models. At the present time, these plasma flow models typically only consider the larger-scale convection flow. Our observation of a significant meso-scale flow vorticity component due to turbulence will have implications for the fidelity of these models.
See paper for further details: Chisham, G. and Freeman, M. P. (2023). Separating contributions to plasma vorticity in the high-latitude ionosphere from large-scale convection and meso-scale turbulence. Journal of Geophysical Research: Space Physics, 128, e2023JA031885, https://doi.org/10.1029/2023JA031885.
Detection of the northern infrared aurora at Uranus using the W.M. Keck II Telescope and NIRSPEC instrument
By Emma Thomas (University of Leicester)
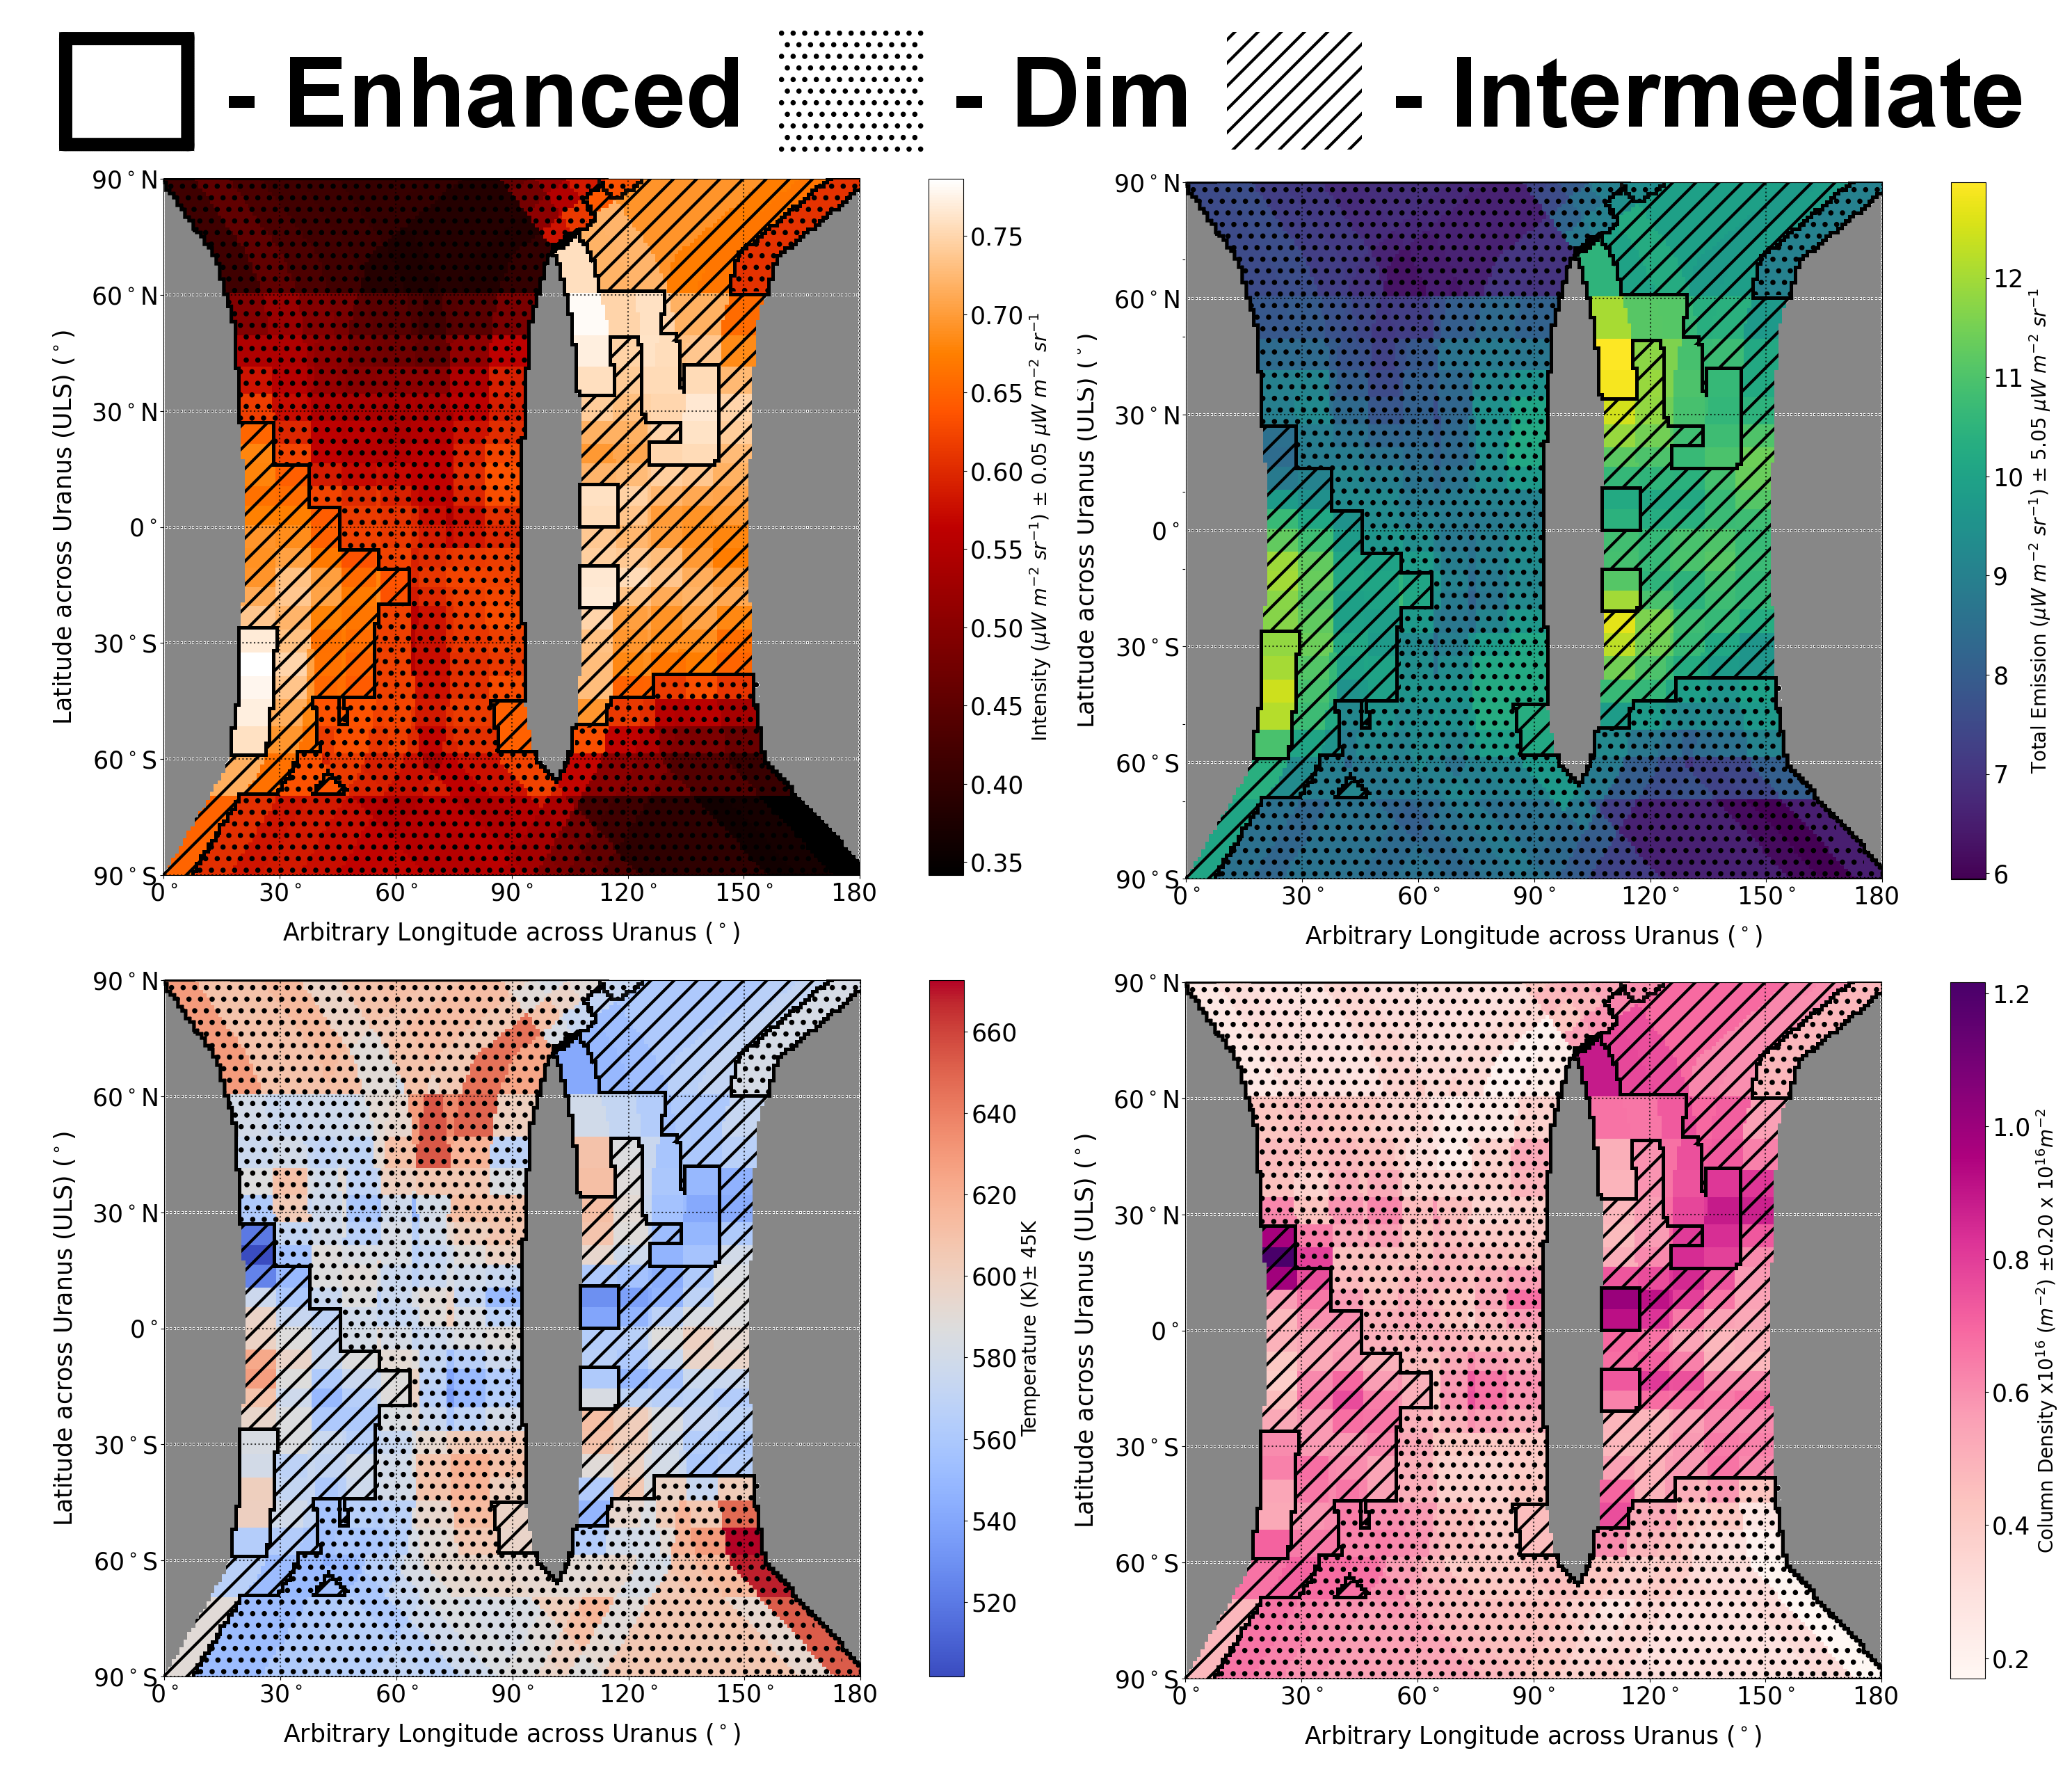
Three decades of searching for the infrared aurorae finally come to a successful conclusion as portions of the northern (IAU southern) aurorae have been confirmed at Uranus. The icy planet represents an enigma within our solar system, with the first and only visit by Voyager II in 1986, it remains one of the least documented planets in our solar system. This is exceptionally apparent with the planet’s history of auroral observations, where the UV aurorae have been observed a handful of times but no infrared (IR) counterpart has been confirmed, despite both aurorae appearing at Jupiter and Saturn. Analysis of IR aurorae at both Jupiter and Saturn have challenged what we know about magnetosphere-ionosphere coupling, highlighting a need for IR analysis at Uranus to uncover its mysteries. Since 2020 our team has meticulously analysed archived data of Uranus during 2006 from the Keck II telescope on Mauna Kea in Hawai’i. The timing of these observations was key, close to equinox, as it provided an optimal view of the predicted locations of the northern and southern aurorae. By examining the emission lines from these aurorae (the emitting ion being H3+) between 3.94 to 4.01 μm, we carried out a full spectrum best fit across 5 fundamental lines for each spatial pixel across the planet’s disk. By comparing these lines at specific locations, we were able to identify an average 88% increase in column ion densities with no significant temperature changes localised close to or at expected auroral locations for the northern aurora. With this confirmation at Uranus, we look forward to a new age of auroral investigations at both ice giant planets.
References:
Thomas, E.M., Melin, H., Stallard, T.S. et al. Detection of the infrared aurora at Uranus with Keck-NIRSPEC. Nat Astron (2023). https://doi.org/10.1038/s41550-023-02096-5