MIST
Magnetosphere, Ionosphere and Solar-Terrestrial
Latest articles
- Temporal Variability of Saturn's H2 Dayglow and Northern Aurora Observed by Hisaki and Cassini
- The Jupiter Auroral Ionosphere Code
- Analysis of Chorus Wave Power on Burst‐Mode Timescales During the Van Allen Probes Era
- Soft X-Ray Emission from Saturn's Magnetosheath II: Solar Wind Driving
- Which Kelvin-Helmholtz waves grow along the spatially-varying magnetopause flanks and why?
Latest news
Open Letter Ready For Signatories
Protect MIST Science! Sign the MIST Community Open Letter on the STFC funding cuts!
https://sites.google.com/view/uk-mist-community-open-letter
Statement from MIST Council regarding the STFC Funding Situation
Statement from MIST Council regarding the STFC Funding Situation
MIST Council is deeply concerned by the ongoing STFC funding uncertainty and its impact on our community and beyond.
The current combination of prospective delayed and reduced funding, together with already volatile financial situations at universities across the UK, is placing significant strain on research groups. In some cases, institutions may be unable to support researchers through gaps between projects, increasing precarity across the community and adding significant pressure on early-career researchers.
We are concerned that continued uncertainty risks accelerating a brain drain from the UK, as skilled researchers reconsider their future in a system offering limited stability. The loss of expertise at any career stage would have lasting consequences for UK space science.
What is going on?
For those that are unaware of the situation, it is complex and evolving. We suggest the following sources to get up to speed on the current developments.
https://ras.ac.uk/news-and-press/news/proposed-budget-cuts-catastrophe-uk-astronomy
What are we doing about it?
Behind the scenes, MIST Council is actively engaging with relevant parties to understand the scale of the challenge and to identify constructive ways forward.
- We are seeking seasoned members of the community to join MIST Council on a task force to help develop options and represent the needs of our community. If you would like to be involved, please reach out to us via the MIST Council email (This email address is being protected from spambots. You need JavaScript enabled to view it.) by the end of this week (13th February 2026).
- In addition to the task force, we want to provide an open forum for discussion and collective input among all members of the wider MIST community. We are exploring options and will be in touch as soon as possible with further details.
- We believe in working together in the face of the current challenges and we are collaborating with UKSP and others to strive for a fair and positive outcome for all. We are reaching out to members of the SSAP (Solar System Advisory Panel) to explore the hosting of a community town hall meeting, like the one already being organised by the AAP (Astronomy Advisory Panel), to provide an open forum for discussion and collective input.
What can you do to help?
There are several open letters representing people in various career stages that have been made available to sign. We encourage you to read the relevant letter(s) and to sign them if you support them:
- Fellowship Holders: https://advancedfellows-openletter-stfc.github.io/index.html
- Early Career Researchers: https://ecr-openletter-stfc.github.io/
The Royal Astronomical Society are also urging Fellows to lobby their MPs against the cuts, and have included a template letter that can be used to do so:
https://ras.ac.uk/news-and-press/news/ras-fellows-urged-lobby-against-unprecedented-cuts
MIST Council will continue to advocate for transparency, stability, and funding structures that recognise both the long-term nature of our science and the people who deliver it.
We thank you for your continued support in this period of uncertainty.
Please contact This email address is being protected from spambots. You need JavaScript enabled to view it. if you have further suggestions.
MIST Council
![]()
Announcement of New MIST Council 2025
We are very pleased to announce the following members of the community have been elected to MIST Council:
- Gemma Bower (University of Leicester), MIST Councillor
- Tom Elsden (University of St Andrews), MIST Councillor
- Cameron Patterson (Lancaster University), MIST Councillor
- Fiona Ball (University of Southampton), Student Representative
They will begin their terms in July 2025.
We thank outgoing MIST Council members: Maria Walach, Chiara Lazzeri and Emma Woodfield. Andy Smith will remain on council a little longer as a co-opted member to cover Rosie Johnson's maternity leave.
The current composition of Council can be found on our website (https://www.mist.ac.uk/community/mist-council).
Announcement of New MIST Councillors.
We are very pleased to announce the following members of the community have been elected unopposed to MIST Council:
- Rosie Johnson (Aberystwyth University), MIST Councillor
- Matthew Brown (University of Birmingham), MIST Councillor
- Chiara Lazzeri (MSSL, UCL), Student Representative
Rosie, Matthew, and Chiara will begin their terms in July. This will coincide with Jasmine Kaur Sandhu, Beatriz Sanchez-Cano, and Sophie Maguire outgoing as Councillors.
The current composition of Council can be found on our website, and this will be amended in July to reflect this announcement (https://www.mist.ac.uk/community/mist-council).
Nominations are open for MIST Council
We are very pleased to open nominations for MIST Council. There are three positions available (detailed below), and elected candidates would join Georgios Nicolaou, Andy Smith, Maria-Theresia Walach, and Emma Woodfield on Council. The nomination deadline is Friday 31 May.
Council positions open for nomination
2 x MIST Councillor - a three year term (2024 - 2027). Everyone is eligible.
MIST Student Representative - a one year term (2024 - 2025). Only PhD students are eligible. See below for further details.
About being on MIST Council
If you would like to find out more about being on Council and what it can involve, please feel free to email any of us (email contacts below) with any of your informal enquiries! You can also find out more about MIST activities at mist.ac.uk. Two of our outgoing councillors, Beatriz and Sophie, have summarised their experiences being on MIST Council below.
Beatriz Sanchez-Cano (MIST Councillor):
"Being part of the MIST council for the last 3 years has been a great experience personally and professionally, in which I had the opportunity to know better our community and gain a larger perspective of the matters that are important for the MIST science progress in the UK. During this time, I’ve participated in a number of activities and discussions, such as organising the monthly MIST seminars, Autumn MIST meetings, writing A&G articles, and more importantly, being there to support and advise our colleagues in cases of need together with the wonderful council members. MIST is a vibrant and growing community, and the council is a faithful reflection of it."
Sophie Maguire (MIST Student Representative):
"Being the student representative for MIST council has been an amazing experience. I have been part of organizing conferences, chairing sessions, and writing grant applications based on the feedback MIST has received. From a wider perspective, MIST has helped to grow and support my professional networks which in turn, directly benefits my PhD work as well. I would encourage any PhD student to apply for the role of MIST Student Representative and I would be happy to answer any questions or queries you have about the role."
How to nominate
If you would like to stand for election or you are nominating someone else (with their agreement!) please email This email address is being protected from spambots. You need JavaScript enabled to view it. by Friday 31 May. If there is a surplus of nominations for a role, then an online vote will be carried out with the community. Please include the following details in the nomination:
- Name
- Position (Councillor/Student Rep.)
- Nomination Statement (150 words max including a bit about the nominee and focusing on your reasons for nominating. This will be circulated to the community in the event of a vote.)
MIST Council details
- Sophie Maguire, University of Birmingham, Earth's ionosphere - This email address is being protected from spambots. You need JavaScript enabled to view it.
- Georgios Nicolaou, MSSL, solar wind plasma - This email address is being protected from spambots. You need JavaScript enabled to view it.
- Beatriz Sanchez-Cano, University of Leicester, Mars plasma - This email address is being protected from spambots. You need JavaScript enabled to view it.
- Jasmine Kaur Sandhu, University of Leicester, Earth’s inner magnetosphere - This email address is being protected from spambots. You need JavaScript enabled to view it.
- Andy Smith, Northumbria University, Space Weather - This email address is being protected from spambots. You need JavaScript enabled to view it.
- Maria-Theresia Walach, Lancaster University, Earth’s ionosphere - This email address is being protected from spambots. You need JavaScript enabled to view it.
- Emma Woodfield, British Antarctic Survey, radiation belts - This email address is being protected from spambots. You need JavaScript enabled to view it.
- MIST Council email - This email address is being protected from spambots. You need JavaScript enabled to view it.
Nuggets of MIST science, summarising recent papers from the UK MIST community in a bitesize format.
If you would like to submit a nugget, please fill in the following form: https://forms.gle/Pn3mL73kHLn4VEZ66 and we will arrange a slot for you in the schedule. Nuggets should be 100–300 words long and include a figure/animation. Please get in touch!
If you have any issues with the form, please contact This email address is being protected from spambots. You need JavaScript enabled to view it..
Sun-to-Mud observations of the May and October storms of 2024: impacts on Ireland’s Space Weather
Sun-to-Mud observations of the May and October storms of 2024: impacts on Ireland’s Space Weather
By Alexandra Ruth Fogg (Dublin Institute for Advanced Studies)
Around the peak of Solar Cycle 25 in 2024, Earth experienced two dramatic geomagnetic storms in May and October. In this study, we track both storms from the Sun, through interplanetary space, to the Earth and finally to the ground over the island of Ireland. We compare and contrasts the storms in terms of both their solar drivers, and their ground impacts. We term the events: the “May” storm which peaks around 11th May 2024 and the “October” storm which peaks around 11th October 2024.
Key comparisons:
- Multiple Coronal Mass Ejections (CMEs) were ejected from the Sun in May, resulting in CME-CME interaction as they propagated through the solar system. In October, a single CME propagated cleanly through the solar system to impact the Earth.
- The May solar active region had a more complex McIntosh classification in May than that observed in October, although their Hale classifications were the same.
- At the Earth, the period preceding the May storm was more quiescent in auroral and equatorial indices, whereas in October strong-moderate precursor activity was observed.
- Locally in Ireland, magnetometer stations observed sudden storm commencements with both storms, but in October this was again preceded by distinct precursor activity.
- Irish magnetometer stations indicate the auroral electrojets are poleward of observations.
- Both storms generate high geoelectric fields over Ireland. South-west Ireland is most susceptible due to particularly resistive geology.
- Moderately high GICs are modelled during both storms.
- Aurorae were visible across Ireland during both storms, including observations in urban regions.
We conclude that while the May storm was driven by a much more complex solar driving event, the Earth is primed by precursor activity in October, enhancing the strength of its response.
See publication for more details:
Fogg, A. R., Lucas, A. R., Hayes, L. A., Ivanov, S. M., Walker, S. J., Malone-Leigh, J., Murray, S. A., Leahy, S. R., Jackman, C. M., Gallagher, P. T. (2026). Sun-to-Mud observations of the May and October storms of 2024: impacts on Ireland’s Space Weather. Journal of Space Weather and Space Climate (Topical Issue - Severe space weather events of May 2024 and their impacts) 16, 2. https://doi.org/10.1051/swsc/2025044
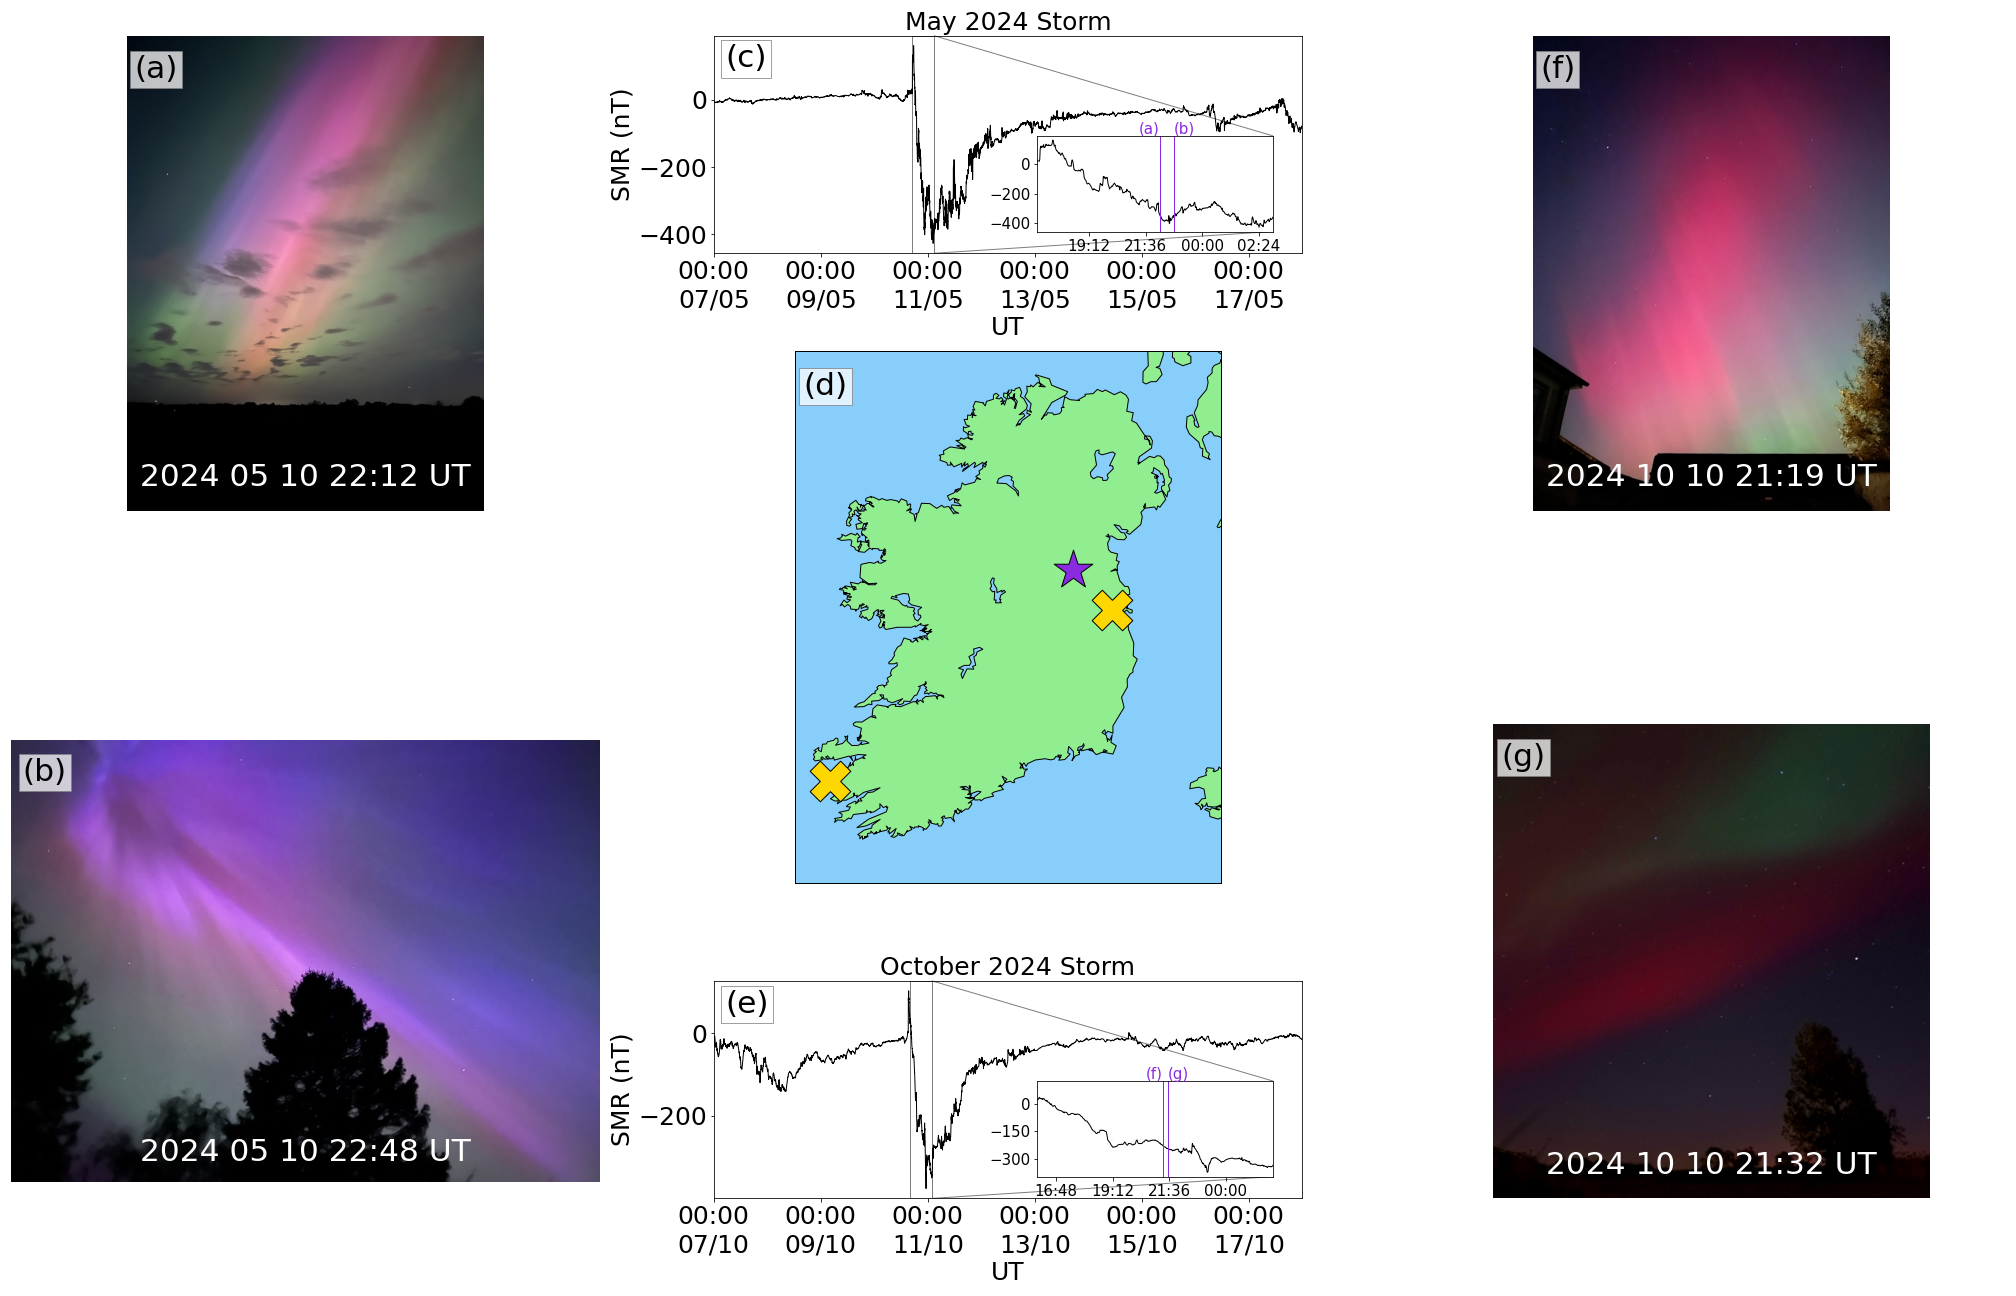
Collection of images of the Aurora taken during both storms in Ireland. All photos were taken near Kells, Co. Meath, approximately indicated by the purple star on the map of Ireland in panel (d). The approximate locations of the MagIE magnetometers at Dunsink (north east) and Valentia (south west) are indicated with yellow crosses in panel (d). (a,b,f,g) show photos taken with an iPhone 13 by S. R. Leahy. (c,e) show timeseries of SMR for the May and October storms respectively, with purple vertical lines on inset panels indicating the timings of each photo.
Fraction of energy carried by coherent structures in the turbulent cascade in the solar wind
Fraction of energy carried by coherent structures in the turbulent cascade in the solar wind
By Alina Bendt (SERENE, School of Engineering, University of Birmingham)
Turbulence is a highly disordered state of flow. It is ubiquitous in astrophysical plasma flows. Turbulence is a proposed mechanism to heat the solar wind, though to what extent turbulence can heat and drive the solar wind is yet an open question. Coherent structures are known to be sites of enhanced dissipation. We use the method proposed by Bendt & Chapman (2025) to distinguish between wave-packets and coherent structures in magnetic field observations by Solar Orbiter and to determine the power that is carried by coherent structures across the inertial (MHD, intermediate scales) and kinetic (small scales) ranges.
We find that coherent structures carry up to a maximum of 50% of the total power in magnetic field fluctuations. In the inertial range, from large to small scales, the percentage of power carried in coherent structures increases roughly linearly at distances less than 0.4 au from the Sun. At larger distances, there are two subranges in the inertial range. In the kinetic range, the percentage of power in coherent structures decreases approximately linearly towards smaller scales.
Our result of a significant percentage of the total power being carried in coherent structures supports the idea that coherent structures are important for turbulent heating of the solar wind. We also provide first insight into the recently discovered behaviour of two subranges in the inertial range.
Reference: Bendt & Chapman 2026 ApJL doi: https://doi.org/10.3847/2041-8213/ae3820
Bendt & Chapman 2025 PhysRevRes doi: https://doi.org/10.1103/PhysRevResearch.7.023176
See publication for details:
A. Bendt and S. C. Chapman 2026 Fraction of Energy Carried by Coherent Structures in the Turbulent Cascade in the Solar Wind ApJL https://iopscience.iop.org/article/10.3847/2041-8213/ae3820
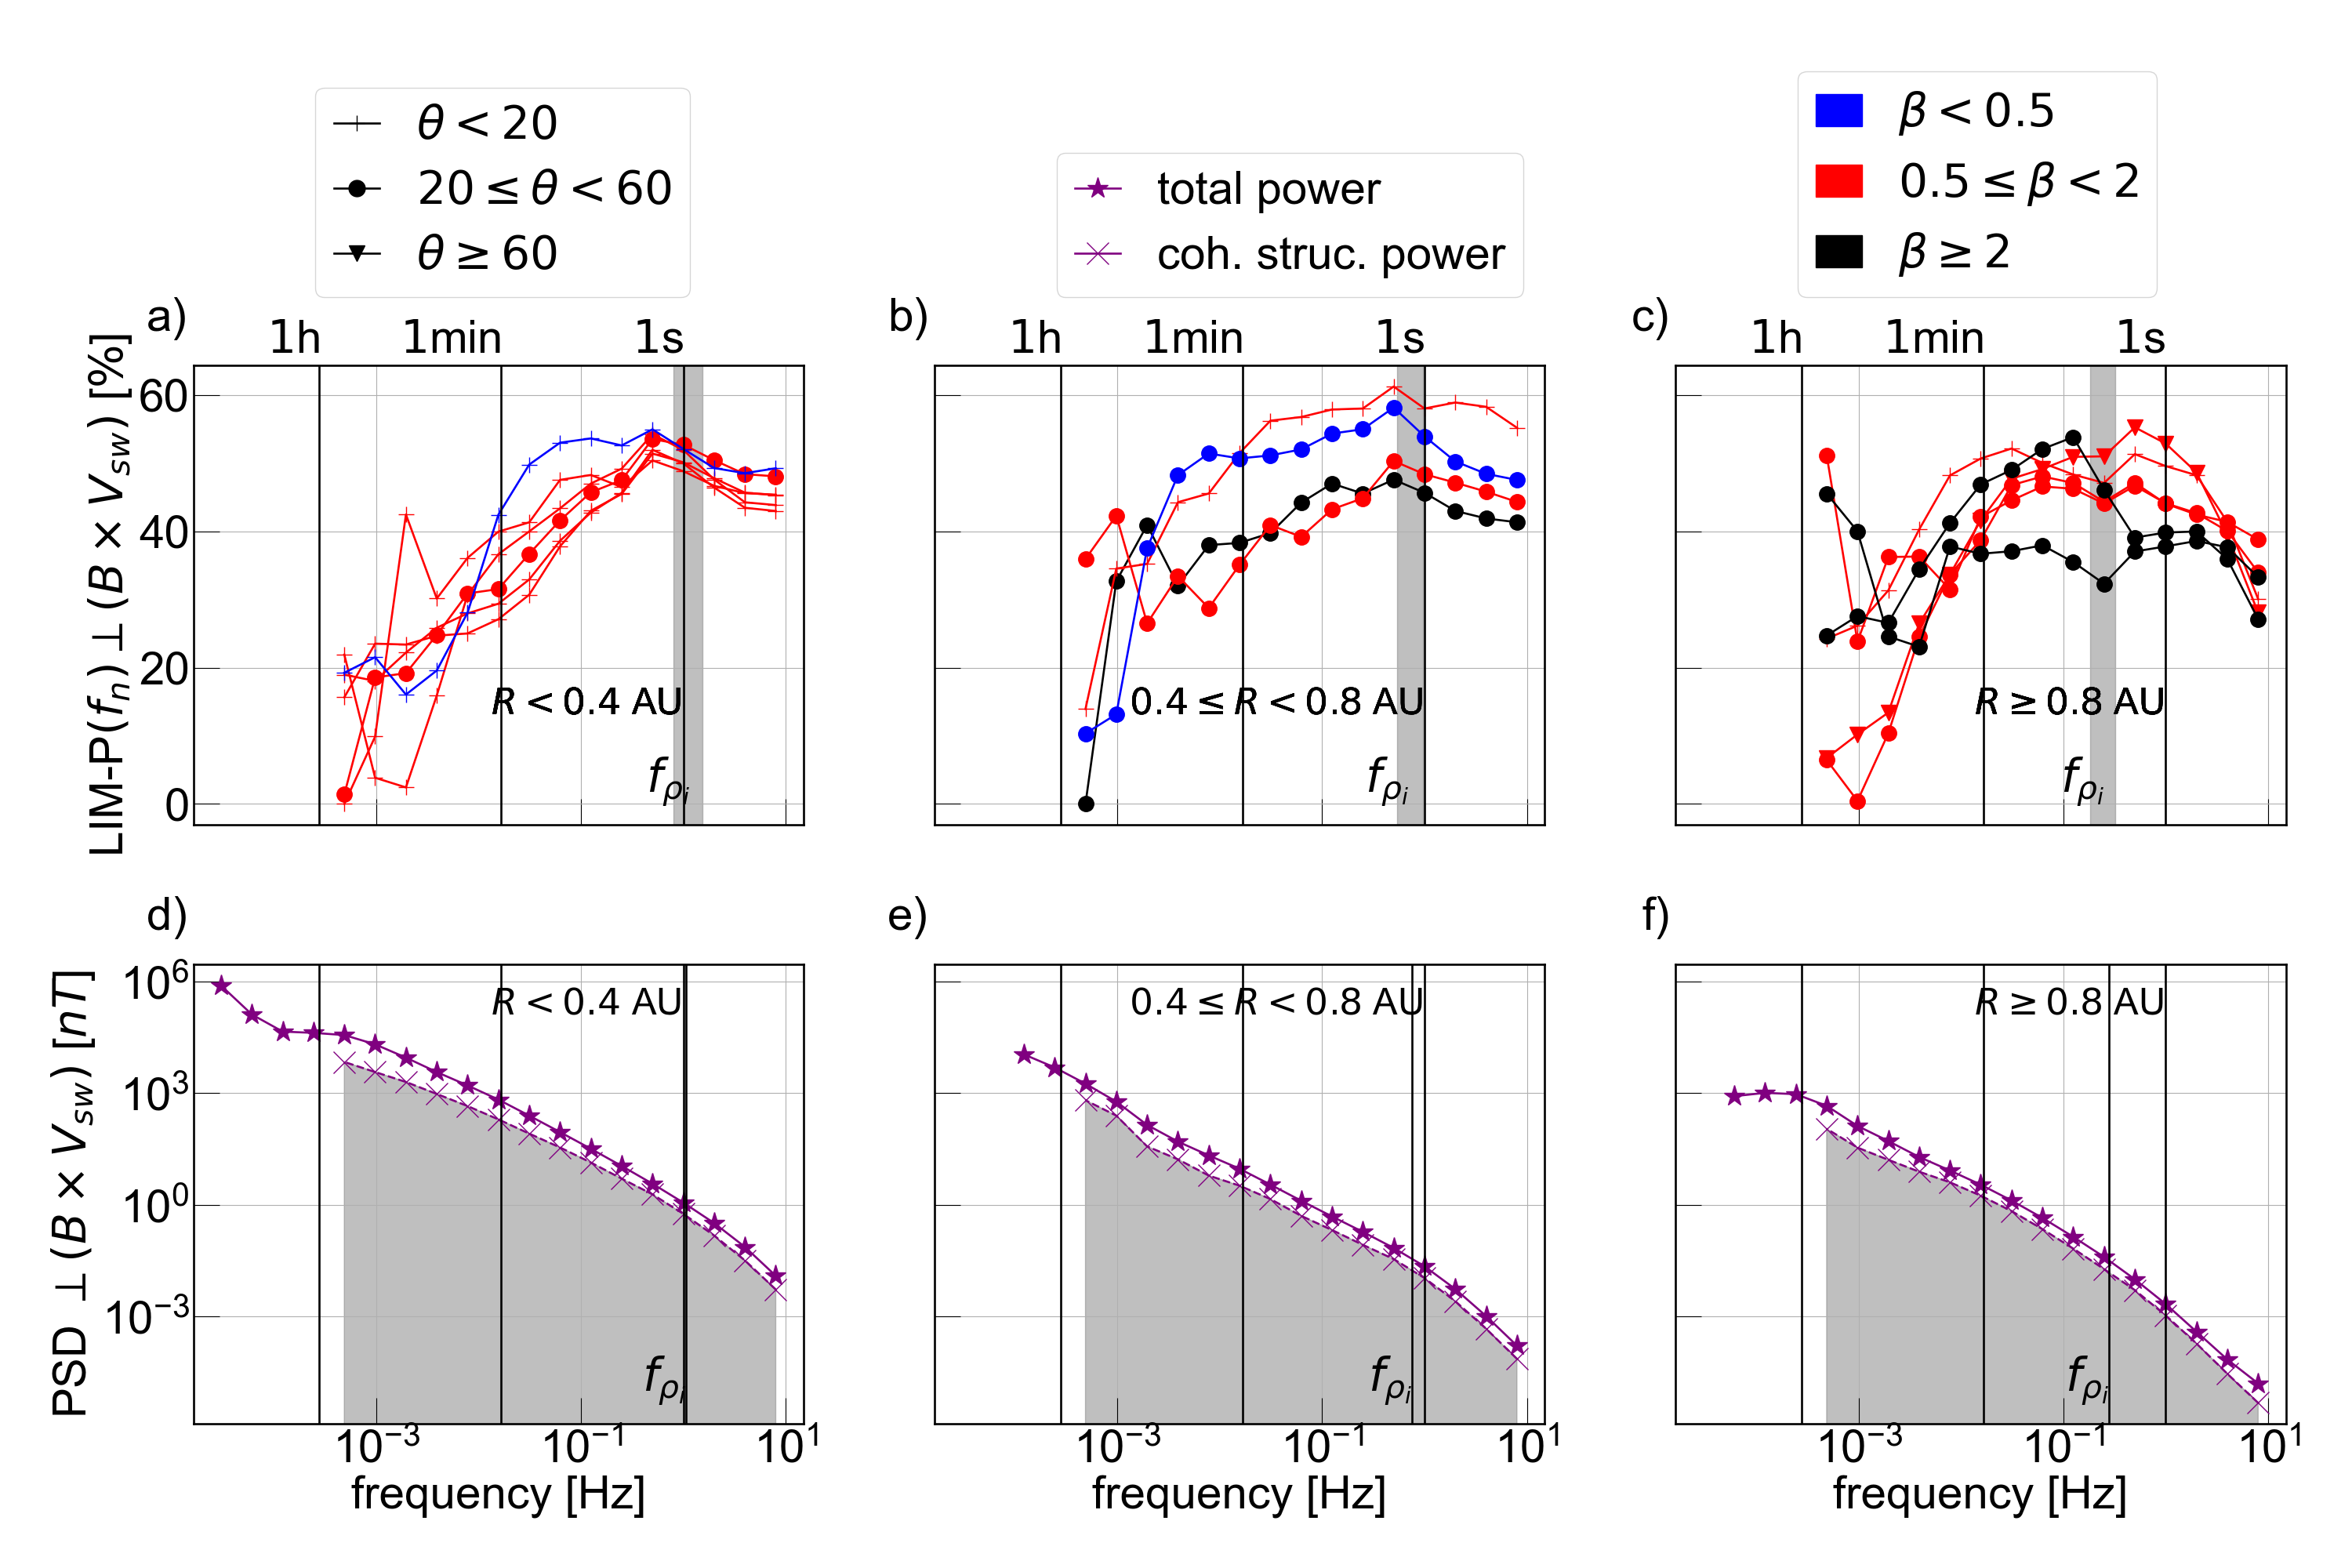
Power in coherent structures as a function of frequency. Results are plotted for the magnetic field component B⟂(BxVsw). Left to right, the panels group the intervals by heliocentric distance: panels (a), (d) R < 0.4 au; panels (b), (e) 0.4 ≤ R < 0.8 au; and panels (c), (f) R ≥ 0.8 au. Upper panels plot the percentage of power in coherent structures LIM-P(fn) and lower panels overplot the power spectral density of coherent structures (purple ×, grey shading) on the total power (purple ⋆) for one of these intervals. On all panels, black vertical lines denote the 1 hr, 1 minute, and 1 s timescales. On upper panels, the vertical grey shading indicates the range of frequencies of the ion-gyro radius of all intervals. The of the single interval shown in the lower panels is indicated by a black vertical line. For the different intervals in the upper panels, the colours denote plasma beta, β < 0.5 (blue), 0.5 ≤ β < 2 (red), and β≥2 (black). Field-alignment angle value (range 0°–90° obtained by folding in angles ≥90°): θ < 20° (+), 20°–60° (∘), and θ ≥ 60° (△).
Global Morphology of Chorus Waves in the Outer Radiation Belt and the Effect of Geomagnetic Activity and fpe/fce
Global Morphology of Chorus Waves in the Outer Radiation Belt and the Effect of Geomagnetic Activity and fpe/fce
By Kaine Bunting (British Antarctic Survey)
Chorus waves are naturally occurring plasma waves often observed in the Earth’s outer radiation belt that strongly influence the behaviour of energetic electrons. These waves can both accelerate electrons to relativistic energies, which poses a threat to satellites, as well as scatter electrons into Earth's atmosphere, where they are consequently lost.
The ratio between the electron plasma frequency (fpe) and electron gyrofrequency (fce) holds information on both electron density and magnetic field strength and significantly influences the efficiency of these processes, with electron acceleration being most effective during periods of low fpe/fce.
Bunting et al. (2026) analyses a combined 24.5 years of wave data from three THEMIS satellites to investigate the effect of fpe/fce, geomagnetic activity and normalized frequency on the spatial distribution and intensity of chorus waves.
The strongest waves are generally observed on the dawn-side of the Earth during active geomagnetic conditions. Figure 1 shows global plots of the equatorial (|MLAT| < 9°) chorus wave intensity during active conditions (AE > 200nT). At intermediate relative frequencies (0.3fce < f < 0.4fce), chorus is largely independent of fpe/fce. However, at low frequencies (flhr < f < 0.1fce), strong waves are most often associated with high fpe/fce (>10) and at high frequencies (0.5fce < f < 0.7fce), chorus is strongest at low fpe/fce (<6).
Overall, this study highlights the critical role of fpe/fce on the spatial distribution and dynamic behaviour of chorus waves under varying geomagnetic conditions, as well as its influence on wave-particle interactions. During a geomagnetic storm fpe/fce outside of the plasmapause may gradually change from low to high values over the course of the recovery phase, suggesting that the role of chorus may change from efficient acceleration early in the recovery phase to little or no acceleration and even loss toward the end of the recovery phase.
See publication for details:
Bunting, K. A., Meredith, N. P., Bortnik, J., Ma, Q., Matsuura, R., & Shen, X.-C. (2026). Global morphology of chorus waves in the outer radiation belt and the effect of geomagnetic activity and fpe/fce. Journal of Geophysical Research: Space Physics, 131, e2025JA034737. https://doi.org/10.1029/2025JA034737
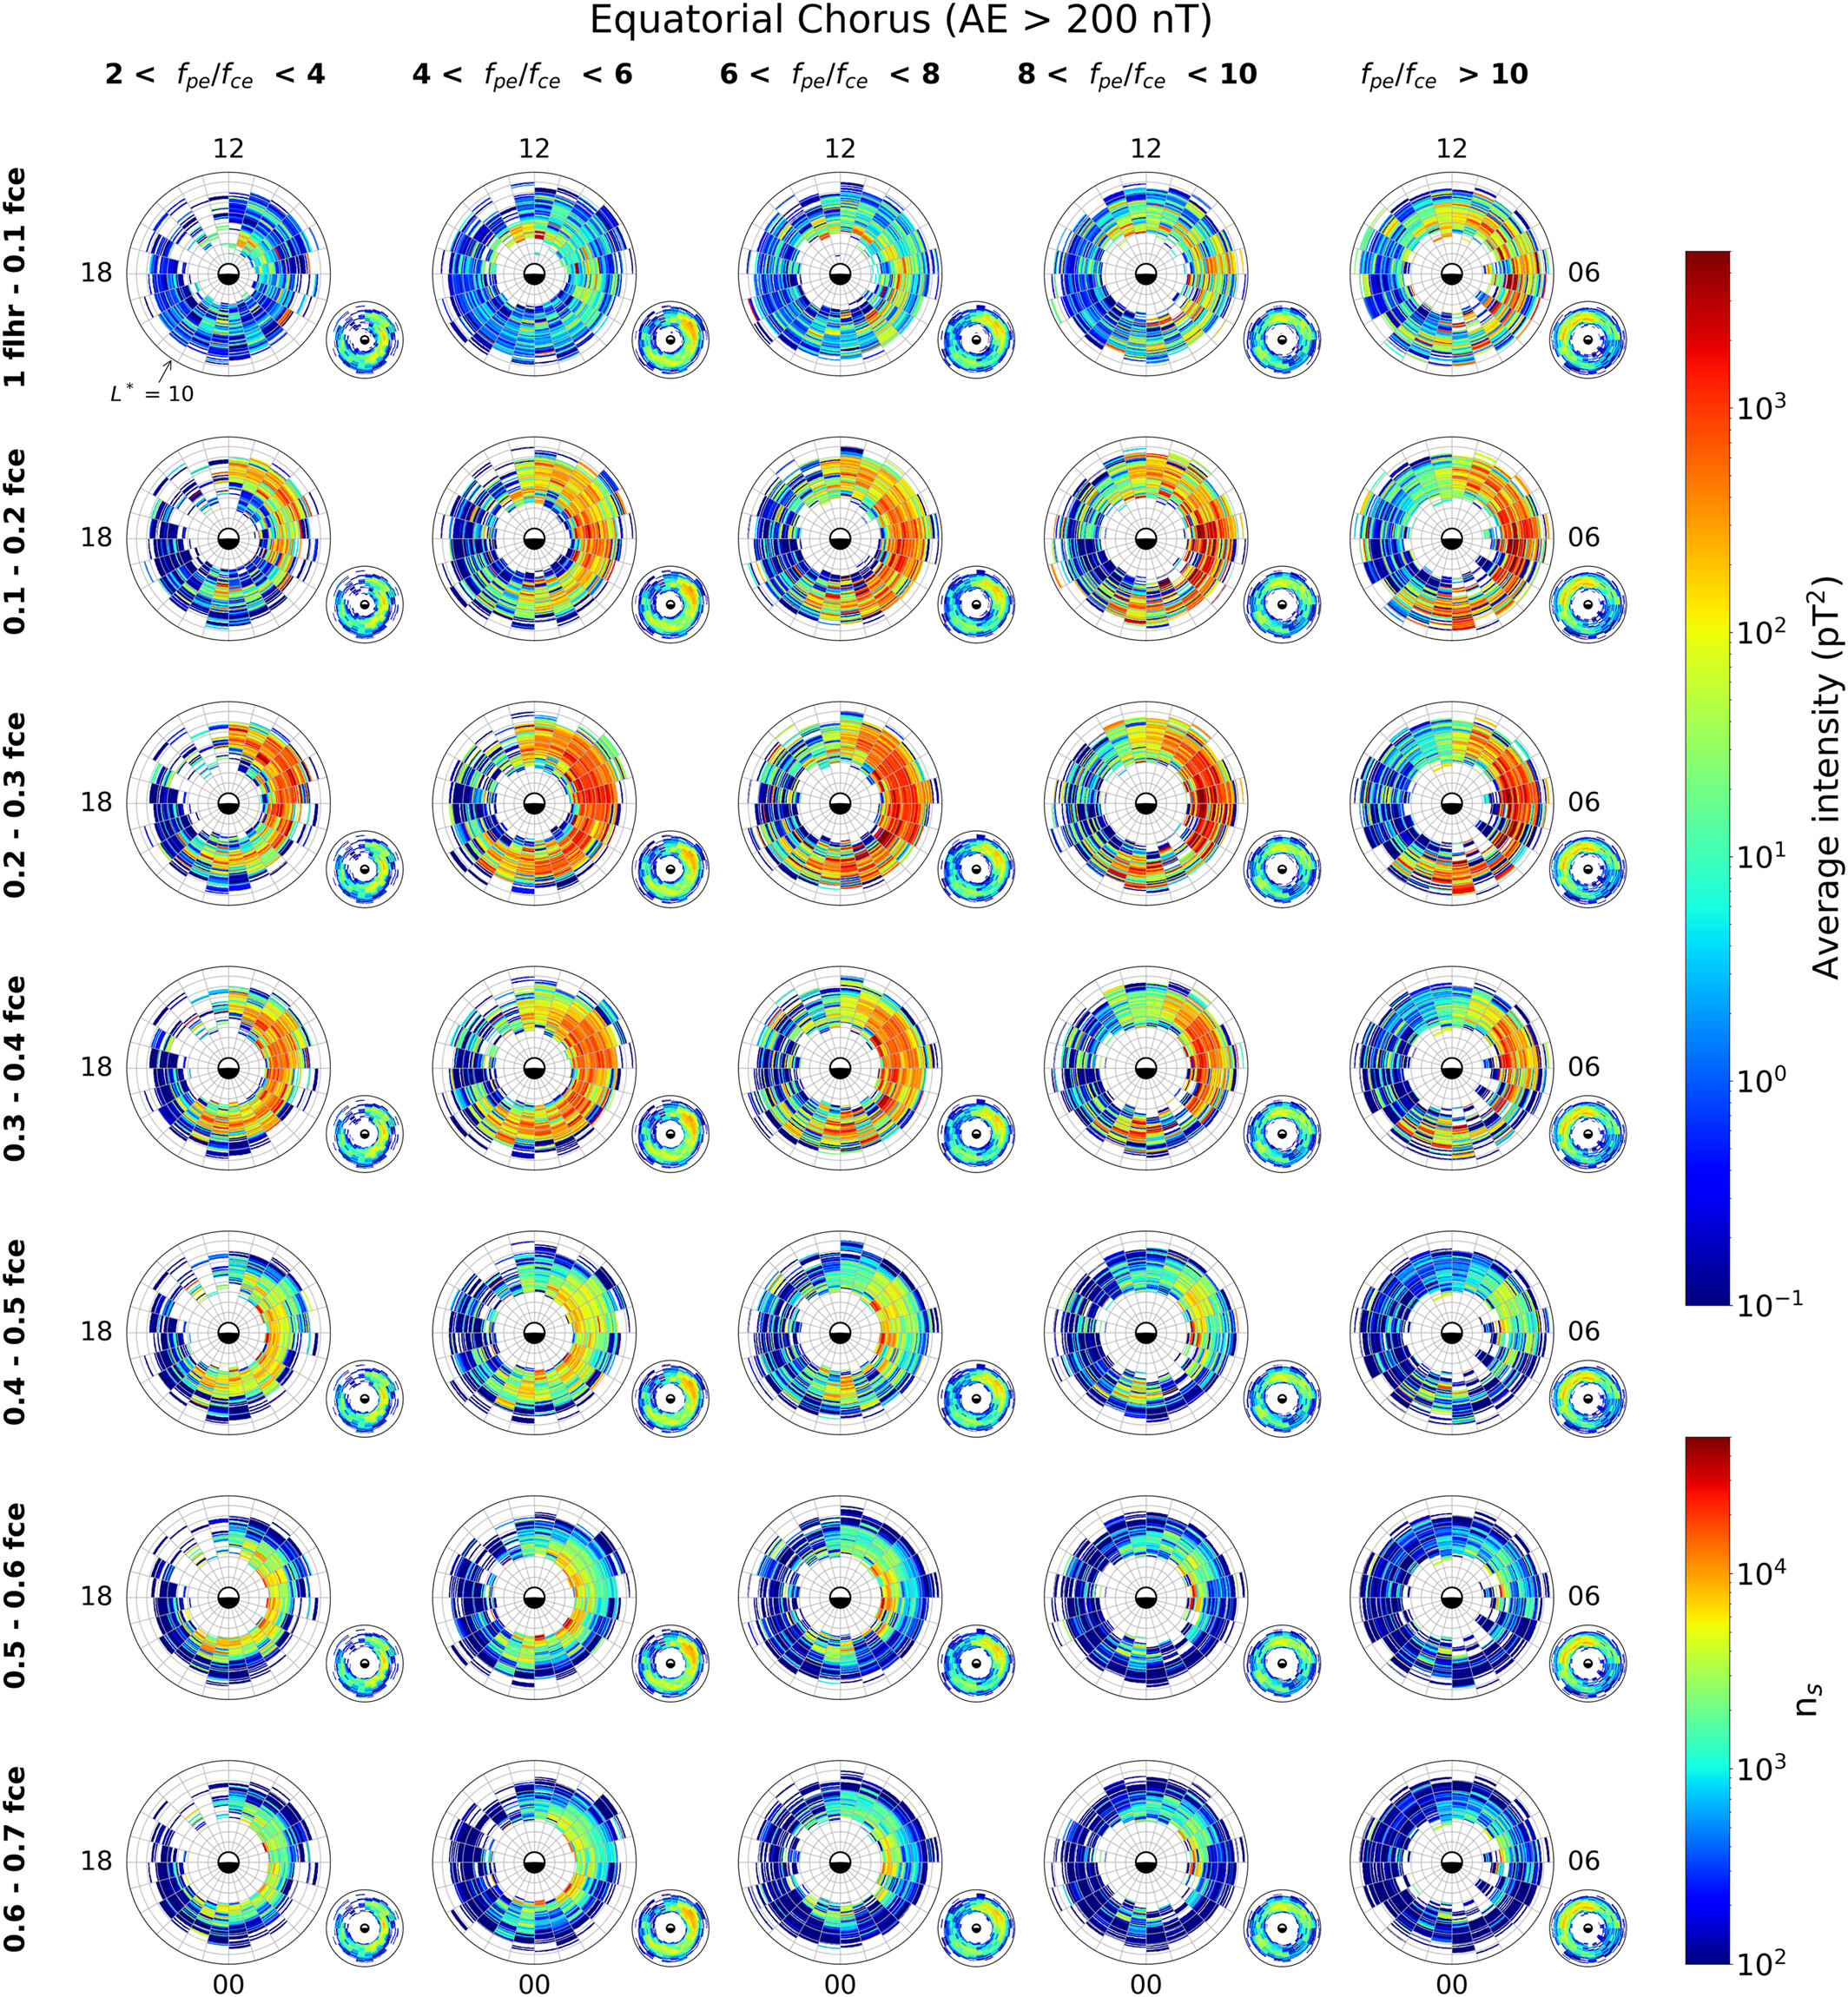
Figure 1 - Global maps of the average chorus wave intensity during active geomagnetic conditions (AE > 200nT) in the equatorial region (MLAT < 9°) as a function of L* and magnetic local time for, from top to bottom, increasing relative frequency, and, from left to right, increasing fpe/fce. The maps extend linearly out to L* = 10 with noon at the top and dawn to the right. The average intensities are shown in the large panels and the corresponding sampling distributions in the small panels to the bottom right of each large panel.
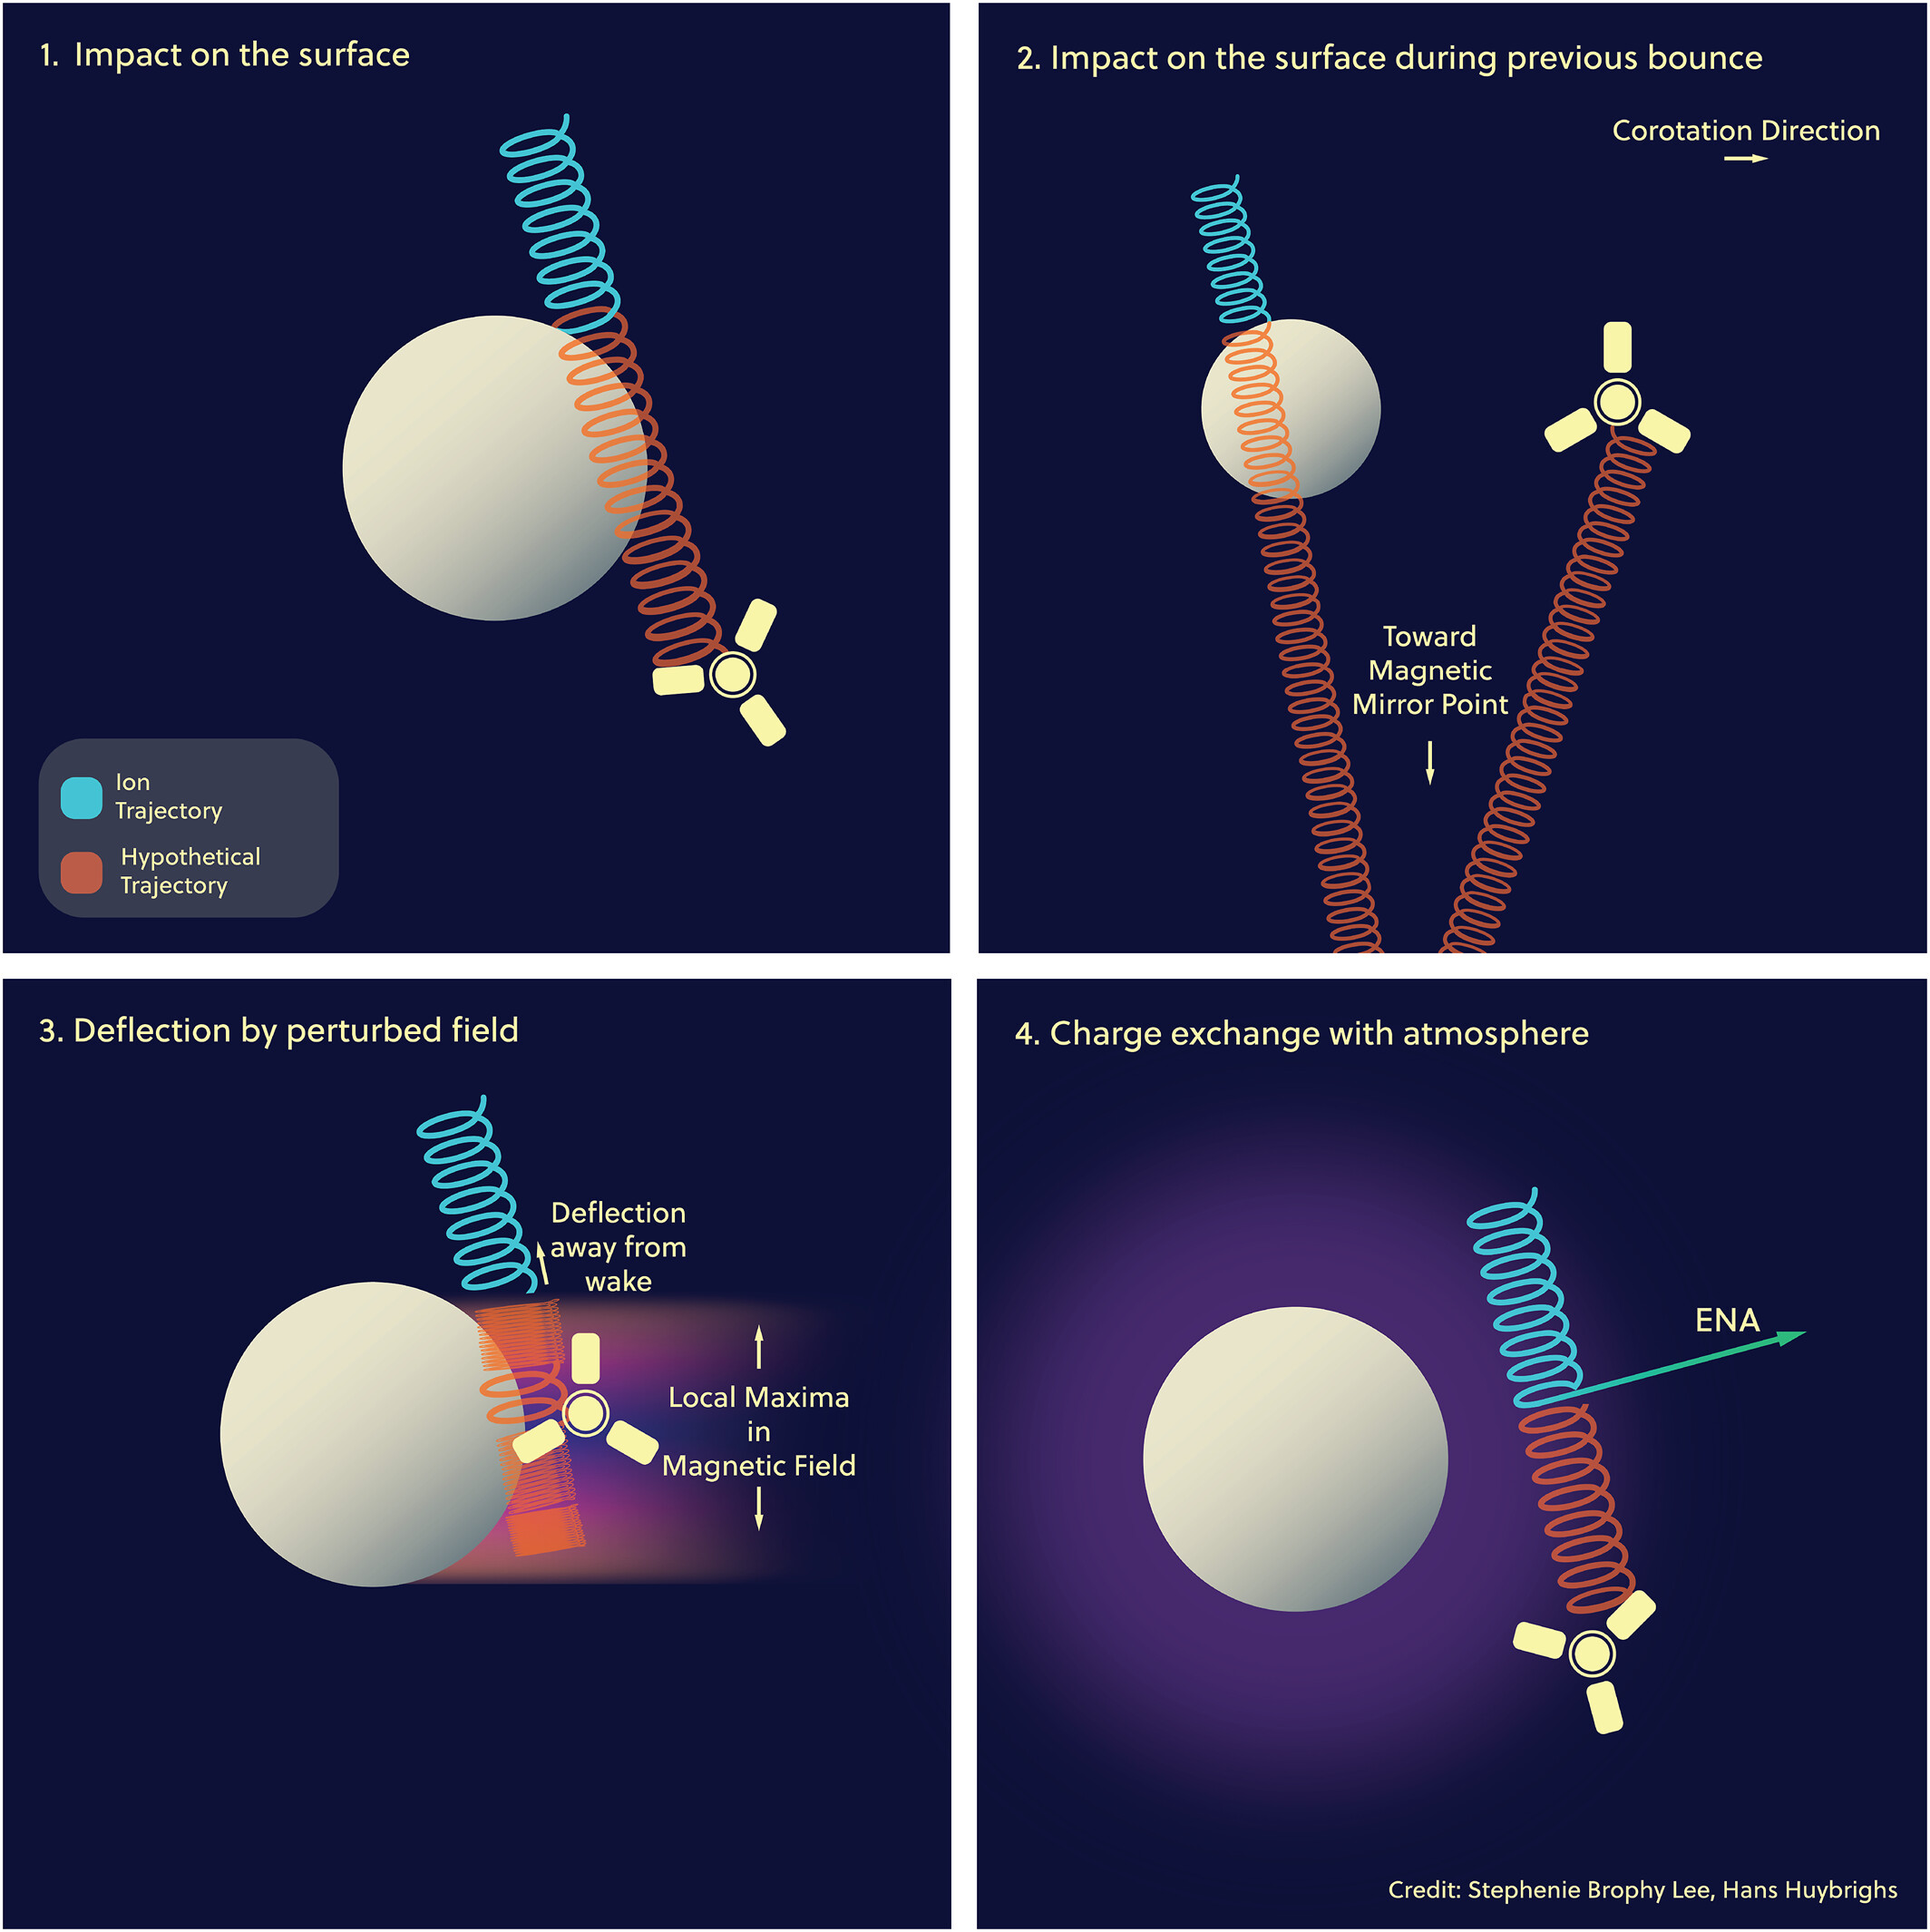
Energetic Proton Dropouts During the Juno Flyby of Europa Strongly Depend on Magnetic Field Perturbations
Energetic Proton Dropouts During the Juno Flyby of Europa Strongly Depend on Magnetic Field Perturbations
By Hans Huybrighs (DIAS)
In September 2022 NASA's Juno spacecraft flew by Jupiter's ocean moon Europa. In this study we analyzed energetic ion dropouts measured near Europa. We care about energetic ions because they bombard Europa's icy surface . While they make the surface inhospitable, they might also help produce oxidants from the ice that could form a source of energy for life in the ocean.
The Juno measurements show what happens with the energetic protons at 350 km above the surface, in Europa’s wake (considering the general sense of motion of the protons). There, protons have disappeared, compared to further away where they are abundant. The cartoon below shows some classical ideas about what happens to the protons near Europa (panel 1-2).
Using particle tracing simulations of the ions we can show that the deflections by magnetic fields (3) are also important. In fact, at 100 keV magnetic deflections are the dominant factor that determine the ion abundance. At 1 MeV its a combination of magnetic deflections and the effect shown in panel 2. The simulations also show that the shape of the proton dropout region depends on the exact configuration of the magnetic field, which can vary depending on the atmosphere and electron beams in the wake. All this helps us better understand what happens with the energetic ions and shows us that our ideas of Europa's atmosphere and magnetic fields are reasonable but that improvements can be made.
See publication for details:
, , , , , , et al. (2025). Energetic proton dropouts during the Juno flyby of Europa strongly depend on magnetic field perturbations. Journal of Geophysical Research: Space Physics, 130, e2025JA034000. https://doi.org/10.1029/2025JA034000
Estimating Soft X-Ray Emission from Uranus's Magnetosheath
Estimating Soft X-Ray Emission from Uranus's Magnetosheath
By Dan Naylor (Lancaster University)
Soft X-rays can be generated within planetary magnetosheaths due to charge exchange between neutrals and highly charged solar wind ions such as O7+. Imaging of the soft X-rays is an emerging technology that aims to provide global and dynamic views of the magnetosheath and cusps, and their response to solar wind driving. The ESA-CAS SMILE mission will soon be launched with a soft X-ray imager (SXI) instrument onboard to investigate the terrestrial magnetosheath. We explore the viability of similar investigations at Uranus.
Uranus has one of the most unusual and complex environments in the solar system. A large obliquity combined with a highly tilted, offset magnetic axis result in an asymmetric and constantly varying magnetosphere where the plasma and neutral source rates from the moons are unconstrained. We impose a simple bullet shaped magnetopause and moon tori informed by Voyager 2 observations to predict soft X-ray emission from the Uranian magnetosheath. We estimate volumetric emission rates of soft X-rays are on the order of 10-10 photon cm-3 s-1, being higher at equinox due to the orientation of the magnetosheath relative to the moon tori. Simple estimates of intensity and flux find that a SMILE-like instrument could detect ~100 photons in a quarter of a planetary rotation at a distance of 212 RU, as shown in the figure. A hypothetical future imager, with improved FOV and effective area, would detect ~20,000 photons per planetary rotation at 100 RU. These are promising initial results that suggest imaging of the magnetosheath is possible within key system timescales. Future studies will include magnetospheric cusps and a full range of solar wind ions, which are anticipated to increase emission rates.
Modelled intensity maps for a SMILE‐like SXI at 212 RU from different viewing geometries at (top row) equinox, where the neutrals are edge-on to the Sun, and (bottom row) solstice, where the neutrals are ring on to the Sun: (a/d) front‐on, (b/e) top‐down and (c/f) side‐on. The different panels show that the amount of flux detected is dependent on viewing position, and an orbital mission should consider the implications of different possible imaging positions.
See publication for details:
Naylor, D., Ray, L. C., Dunn, W. R., Jasinski, J. M., & Paty, C. (2025). Estimating soft X-ray emission from Uranus's magnetosheath. Journal of Geophysical Research: Space Physics, 130, e2025JA034171. https://doi.org/10.1029/2025JA034171