MIST
Magnetosphere, Ionosphere and Solar-Terrestrial
Nuggets of MIST science, summarising recent papers from the UK MIST community in a bitesize format.
If you would like to submit a nugget, please fill in the following form: https://forms.gle/Pn3mL73kHLn4VEZ66 and we will arrange a slot for you in the schedule. Nuggets should be 100–300 words long and include a figure/animation. Please get in touch!
If you have any issues with the form, please contact This email address is being protected from spambots. You need JavaScript enabled to view it..
An inner boundary condition for solar wind models based on coronal density
By Kaine Bunting (Aberystwyth University)
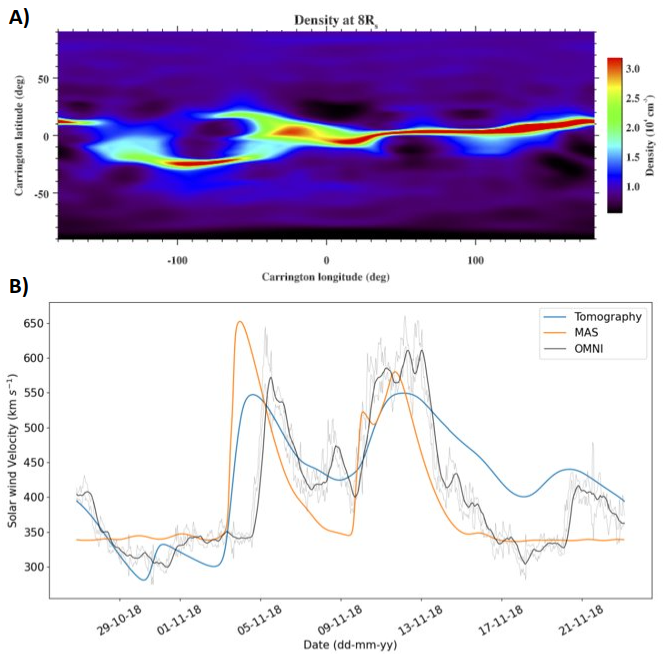
Tomography is used to gain the 3D plasma density of the solar corona (between 4-8Rs) using white light coronagraph observations (Morgan and Cook 2019). In this work, we use the density at 8Rs (e.g. figure 1a) to estimate velocity, providing an inner boundary condition for a heliospheric solar wind model. The results show that tomography can provide a valid (or improved) alternative to traditional photospheric-based magnetic models.
A simple inverse linear relationship converts densities to velocities. Extracted from Earth's latitude, the velocities form an inner boundary condition for the Time-dependent Heliospheric Upwind Extrapolation (HUXt) model (Owens et al. 2020). The model is then simulated for one Carrington rotation (CR), giving predicted velocities at Earth. The modelled velocities are compared to OMNI in-situ data, and the efficiency of HUXt allows an iterative fitting method optimises the parameters of the density-velocity conversion model by minimising a ‘distance’ metric using Dynamic Time Warping (DTW, Samara et al. 2022).
Figure 1 b) compares the output of HUXt based on Tomography-HUXt and MAS inner boundaries (Linker et al. 1999), where the MAS velocities have been optimised similarly to the tomography velocities for CR2210 (Nov 2018). Tomography-HUXt model outperforms the MAS-HUXt model: tomography-HUXt gives a MAE of 47.9 km s-1 compared to the 53.58 km s-1 of the MAS-HUXt model, and a higher Pearson correlation coefficient of 0.74 compared to that of MAS-HUXt (0.56). This work shows that inner boundary conditions derived using tomography are a valid alternative to magnetic models such as MAS.
Our current work investigates a more advanced relationship between coronal densities and velocities, and provides improved solar wind predictions over a whole solar cycle. This scheme is implemented as part of the SWEEP software suite for the UK Met Office's space weather forecasting capabilities from 2023 onwards.

References:
Linker, J. A., Z. Miki ́c, D. A. Biesecker, R. J. Forsyth, S. E. Gibson, et al. 1999. Magnetohydrodynamic modeling of the solar corona during Whole Sun Month. Journal of Geophysical Research: Space Physics, 104. 10.1029/1998ja900159.
Morgan, H., and A. C. Cook, 2020. The Width, Density, and Outflow of Solar Coronal Streamers. The Astrophysical Journal, 893(1), 57. 10.3847/1538-4357/ab7e32
Owens, M. J., M. Lang, L. Barnard, P. Riley, M. Ben-Nun, et al. 2020. A Computationally Efficient, Time-Dependent Model of the Solar Wind for Use as a Surrogate to Three-Dimensional Numerical Magnetohydrodynamic Simulations. Solar Physics. 10.1007/s11207-020-01605-3
Samara, E., B. Laperre, R. Kieokaew, M. Temmer, C. Verbeke, et al. 2022. Dynamic Time Warping as a Means of Assessing Solar Wind Time Series. The Astrophysical Journal, 927(2), 187. 10.3847/1538-4357/ac4af6
Temporal variability of quasi-linear pitch-angle diffusion
By Clare Watt (Northumbria University)
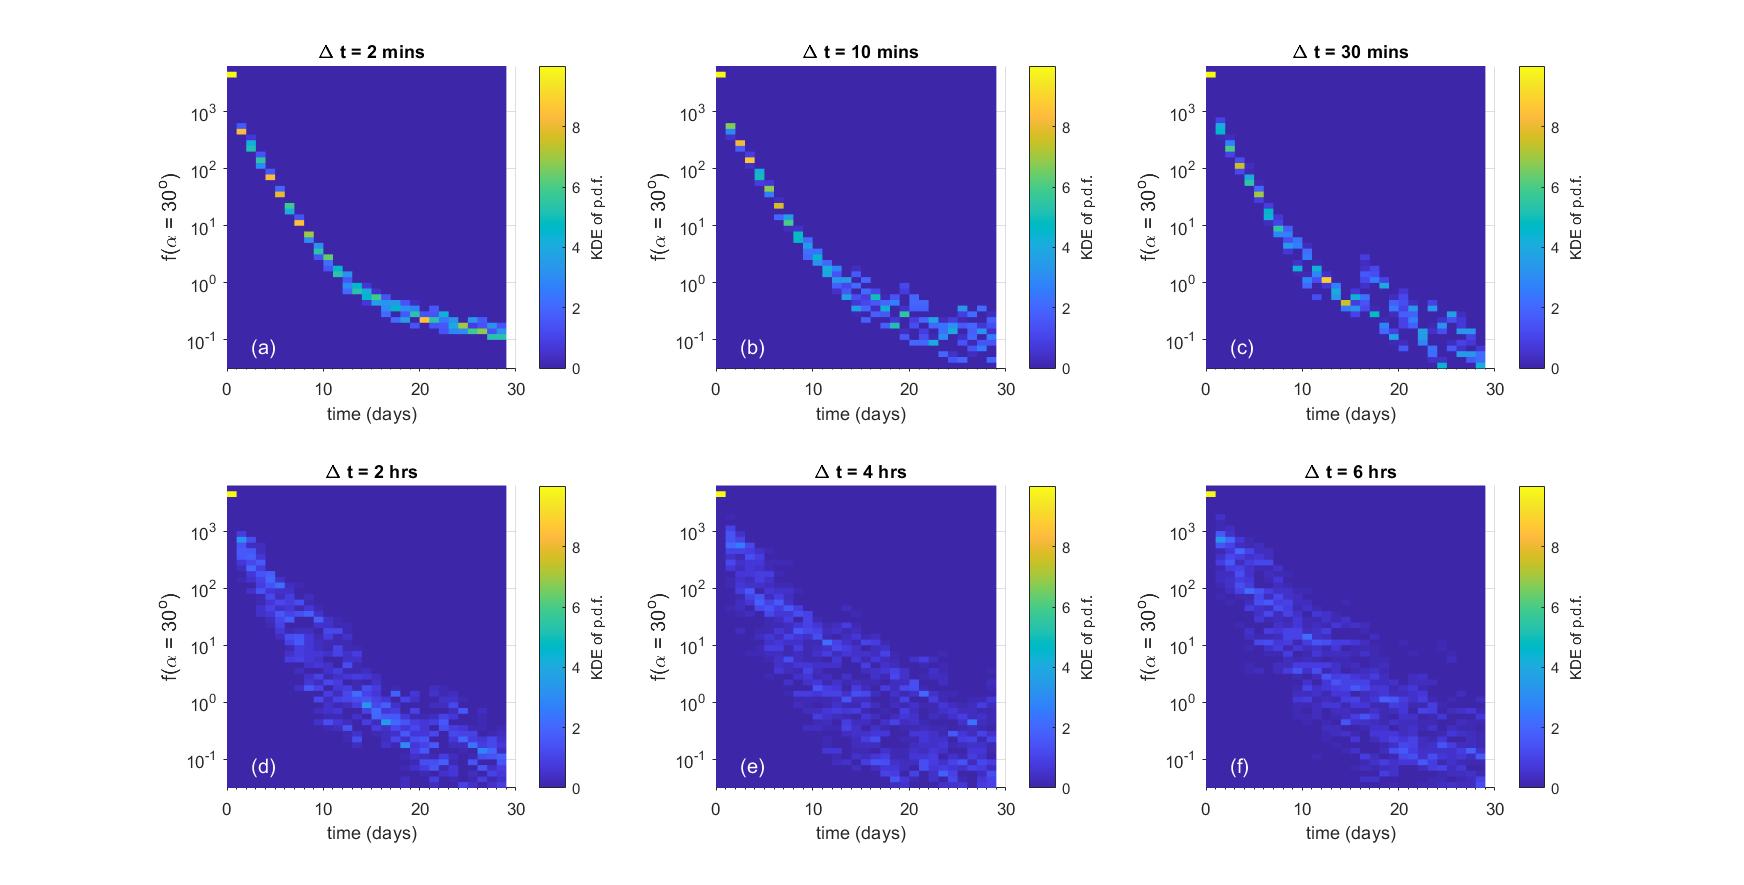
Our work here combines observations and ensemble numerical simulations to study the effect of temporal variability in radiation belt physics. Kinetic wave-particle interactions in Earth’s outer radiation belt are an effective way to energize and scatter high-energy electrons. A Fokker-Planck equation is often used to model the wave-particle interactions, and we studied the way it responds to the temporal variation of the quasi-linear diffusion coefficient in the case of pitch-angle diffusion due to plasmaspheric hiss. We used stochastic parameterisation [Berner et al., 2017] to describe the temporal evolution of hiss diffusion coefficients in ensemble numerical experiments, guided throughout by observations of wave activity and plasma parameters from the NASA Van Allen Probes. Ensemble solutions of the Fokker-Planck equation depend significantly on the timescale of variation, varied here between minutes and hours. We analysed timescales over which it is useful to construct diffusion coefficients and conclude that there is a useful maximum averaging timescale that should be used to construct a diffusion coefficient from observations. This timescale is likely less than the orbital period of most inner magnetospheric missions. Although arithmetic averaging of inputs to diffusion coefficients is not recommended [Watt et al., 2019], arithmetic drift-averaging of the diffusion coefficients themselves can be appropriate in some cases. We found that in some locations, rare but large values of the diffusion coefficient occur during periods of relatively low number density. Ensemble solutions are sensitive to the presence of these rare values, supporting the need for accurate cold plasma density models in radiation belt descriptions.

Figure 1: Ensemble results for numerical diffusion experiments using Dαα(L* = 3). Each panel shows a column-normalised probability distribution function for the phase space density f just outside the loss-cone αLC for (A) Δt = 2 min, (B) Δt = 10 min, (C) Δt = 30 min, (D) Δt = 2 h, (E) Δt = 4 h, and (F) Δt = 6 h. Note that each histogram is displayed using the same vertical binning, giving the histograms a pixelated appearance.
References:
Berner, J., et al. (2017) Stochastic parameterization: towards a new view of weather and climate models. Bulletin of the American Meteorological Society, 98 (3). pp. 565-588. ISSN 1520-0477 doi: https://doi.org/10.1175/BAMS-D-15-00268.1
Watt, C. E. J., Allison, H. J., Meredith, N. P., Thompson, R. L., Bentley, S. N., Rae, I. J., et al. (2019). Variability of quasilinear diffusion coefficients for plasmaspheric hiss. J. Geophys. Res. Space Phys. 124, 8488–8506. doi:10.1029/2018ja026401
Associated Paper:
Watt, C. E. J., Allison, H. J., Bentley, S. N., Thompson, R. L., Rae, I. J., Allanson, O., … Killey, S. (2022). Temporal variability of quasi-linear pitch-angle diffusion. Frontiers in Astronomy and Space Sciences. https://www.frontiersin.org/articles/10.3389/fspas.2022.1004634
Filling in the gaps in the UK magnetic field coverage
Ciaran Beggan (British Geological Survey)
Monitoring the ground magnetic field variation during space weather events, such as geomagnetic storms, is important for understanding and modelling their potentially hazardous effects on power, rail, and pipeline systems. The UK has three geomagnetic observatories in Lerwick, Eskdalemuir and Hartland. These form an approximately north-south line in latitude but have little variation in longitude. To expand the coverage in the east-west directions, as part of the SWIMMR N4 project, the British Geological Survey geomagnetism team have installed three new variometer stations in Northern Ireland, Leicestershire, and Sussex (Figure 1, left). These systems consist of a three-axis vector fluxgate magnetometer, a digitiser/logger computer and a 4G modem to transmit near-real-time data. The systems use batteries and a solar panel for independent power supply (Figure 1, centre).
Two systems were installed in fields in rural areas, at Florence Court (FLO) National Trust and near Market Harborough (LEI) while the third is located at the Space Geodesy Facility in Herstmonceux (HTX). The magnetic data quality is good and suitable for space weather monitoring purposes. The three new variometers fill in the ‘gaps’ between the BGS and other INTERMAGNET observatories reducing the inter-site distance to less than 400 km (Figure 1, right), thus improving the overall coverage.
The variometers will run for two years initially as part of the SAGE project to enhance geoelectric field modelling capabilities in the UK.

The Harmonic Frequency Separation of Ionospheric Alfvén Resonances at Eskdalemuir
Rosie Hodnett (University of Leicester)
Ionospheric Alfvén resonances (IAR) occur when Alfvén waves are partially reflected at boundaries in the ionosphere where there are large changes in plasma mass density. These boundaries are the bottom of the ionosphere and above the F-Region peak. This sets up a resonance (Belyaev et al., 1990).
IAR have been observed in the induction coil magnetometer data at Eskdalemuir Geophysical Observatory, which is a British Geological Survey site (Beggan & Musur, 2018).
We have modelled the harmonic frequency separation (Δf) of the IAR, by modelling the Alfvén velocity and calculating the time taken for the wave to travel up and down the IAR cavity. We used the International Reference Ionosphere to model the plasma mass density and the International Geomagnetic Reference Field to model the magnetic field strength.
To find the average Δf from the data, we used machine learning to identify the IAR harmonics in spectrograms, and then automatically extracted the frequencies. We used a u-net (Ronneberger et al., 2015) which was developed by Marangio et al. (2020) to detect the IAR.
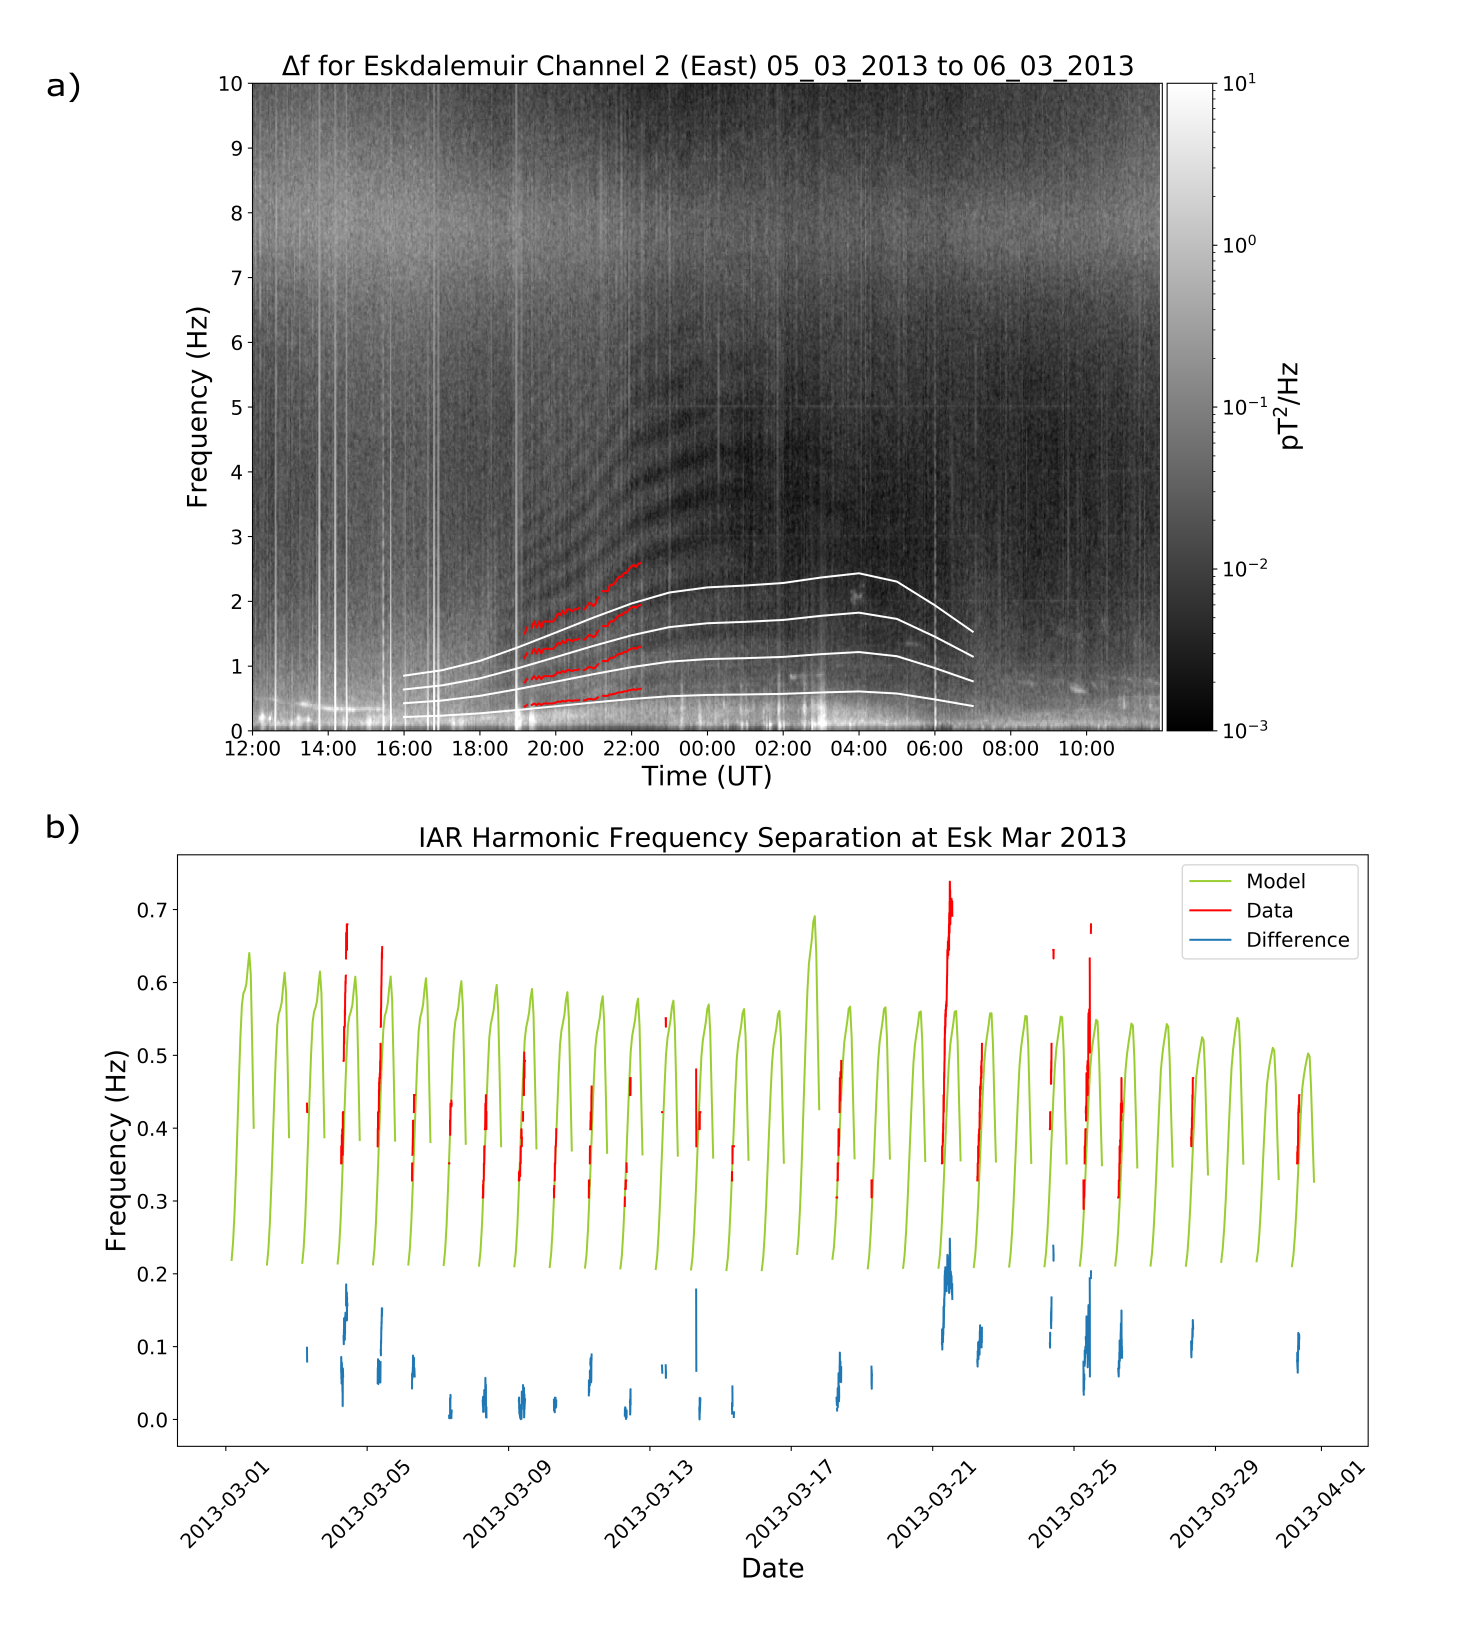
Figure a) shows the spectrogram for 05/03/2013 – 06/03/2013. The IAR harmonics are visible as bright fringes. The red line lowest in frequency is the average Δf extracted from the data, with subsequent red lines being 2 x Δf, 3 x Δf and 4 x Δf. These are plotted so we can see the Δf following the trends of the harmonics. The lowest white line is the modelled Δf, with higher white lines being higher orders. Generally, the model agrees fairly well with the data. Here, both the data and the model show Δf increasing from dusk to midnight. The data diverges from the model later on, indicating that the model does not accurately capture the ionosphere at this time.
Figure (b) shows the modelled Δf in green, Δf from the data in red and the absolute difference between them in blue, for March 2013. Overall, the data and the model agree well. On 21/03/2013, there is a greater difference between the model and data than other days. Examples like this will be investigated further.
We are now performing further analysis of the 9 year dataset, including a comparison of the data and model to foF2, sunspot number, Sym-H and Kp.

References:
Beggan, C. D., & Musur, M. (2018). Observation of Ionospheric Alfvén Resonances at 1-30 Hz and their Superposition with the Schumann Resonances. Journal of Geophysical Research: Space Physics, 123 (5), 4202–4214. doi: 10.1029/2018ja025264
Belyaev, P., Polyakov, S., Rapoport, V., & Trakhtengerts, V. (1990). The Ionospheric Alfvén Resonator. Journal of Atmospheric and Terrestrial Physics, 52 (9), 781–788. doi: 10.1016/0021-9169(90)90010-k
Marangio, P., Christodoulou, V., Filgueira, R., Rogers, H. F., & Beggan, C. D. (2020). Automatic Detection of Ionospheric Alfvén Resonances in Magnetic Spectrograms using U-Net. Computers amp; Geosciences, 145 , 104598. doi:10.1016/j.cageo.2020.104598
Ronneberger, O., Fischer, P., & Brox, T. (2015). U-Net: Convolutional Networks for Biomedical Image Segmentation. Lecture Notes in Computer Science, 234–241. doi:10.1007/978-3-319-24574-4 287
Acknowledgements:
BGS: www.geomag.bgs.ac.uk/operations/eskdale.html
IRI: www.irimodel.org
IGRF: https://www.ngdc.noaa.gov/IAGA/vmod/igrf.html
Jupiter’s X-Ray and UV Dark Polar Region
By Daisy May and Ben Sipos (St Gilgen’s School)
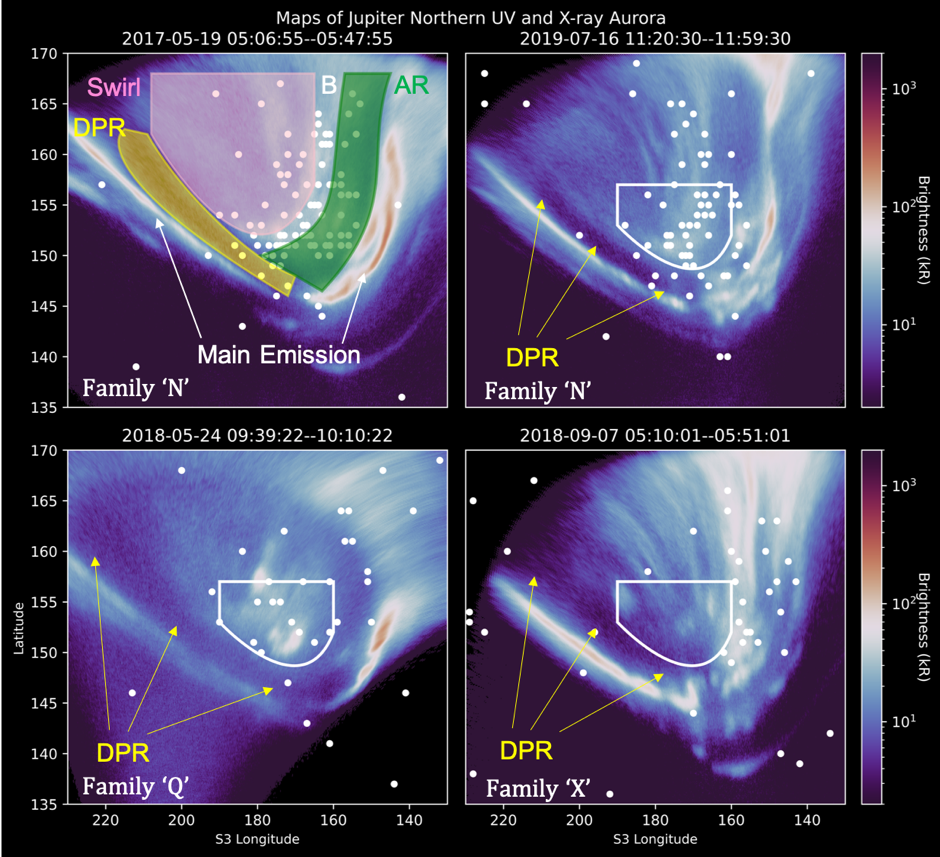
Jupiter produces powerful ultraviolet (UV) and X-ray aurorae at the planet’s poles. The emissions take on a variety of dynamic structures, particularly in the swirl and active regions (Figure 1). However, the dark polar region (DPR) consistently demonstrates a lack of auroral emissions. 14 simultaneous Chandra X-ray Observatory and Hubble Space Telescope observations of Jupiter’s Northern aurorae (between 2016 and 2019) revealed that no statistically significant X-ray signature is detectable within the DPR.
There were two potential non-DPR sources that might have contributed DPR photons, that needed to be considered. The first source was scattered solar photons. By shifting a region the same shape and size as the observed DPR across non-auroral longitudes of the planet, and scaling the photon counts to the duration of the HST observation, we determined the expected number of scattered photons in the DPR for each observation (0.3 to 1.4 counts depending on the DPR size, distance to Jupiter, and solar activity).
The second source was emissions perceived to have come from within the DPR due to the spatial uncertainty of the X-ray Observatory. To determine the count of such photons, we simulated where photons that were produced from the active and swirl regions would have been detected when passed through the spatial uncertainties applied by the X-ray observatory. After 100,000 simulations for each observation, we determined the count of such falsely detected photons, and found that there is no statistically significant X-ray detection from the DPR for these 14 observations.
The lack of x-rays implies low levels of precipitation by solar wind and energetic magnetospheric ions in the DPR. Therefore, the observations are consistent with the DPR being associated with either: Jupiter’s open field line region and/or the DPR containing different potential drops or an absence of the strong downward currents and/or wave-particle interactions present across the rest of the polar aurorae.
This research project was undertaken with the Orbyts programme which partners scientists with schools to support school student involvement in research and to improve inclusivity in science. This nugget was written by two school students who produced a significant proportion of the work in the associated paper.

Figure 1: Overlaid simultaneous UV (blue-white-red color map) and X-ray photon (white dots) longitude-latitude maps of Jupiter's North Pole, from the Hubble Space Telescope (HST) and Chandra X-ray Observatory High Resolution Camera (CXO-HRC). Dates and times of the observations (UT) are at the top of each panel. Only UV and X-ray emissions produced during this time window are shown. Jupiter’s main emission is labelled by white arrows, the dark polar region (DPR) is shown in yellow, the Swirl region is shown in pink and the Active Regions (sometimes split into a noon and dusk active region) are shown in Green. The boundary between the active region and swirl region (here labelled with a white “B”) sometimes includes an arc of UV and X-ray emission, as is the case for the two different observations shown in the top two panels here. The other panels highlight three different UV aurora families, as indicated by the white label in the lower left corner of each (Grodent et al. 2018). The white shape overlaid onto each map is consistent across each, and highlights the changing spatial distribution of X-rays for each. For each panel, the location and extent of the DPR are indicated with yellow arrows, showcasing its changing extent from observation-to-observation.
References: Grodent, D., Bonfond, B., Yao, Z., Gérard, J.-C., Radioti, A., Dumont, M., et al. (2018). Jupiter’s aurora observed with HST during Juno orbits 3 to 7. Journal of Geophysical Research: Space Physics, 123(5), 3299– 3319.
Associated Paper: Dunn, W.R., Weigt, D.M., Grodent, D., Yao, Z.H., May, D., Feigelman, K., Sipos, B., Fleming, D., McEntee, S., Bonfond, B. and Gladstone, G.R., 2022. Jupiter’s X‐ray and UV Dark Polar Region. Geophysical Research Letters, p.e2021GL097390.