MIST
Magnetosphere, Ionosphere and Solar-Terrestrial
Nuggets of MIST science, summarising recent papers from the UK MIST community in a bitesize format.
If you would like to submit a nugget, please fill in the following form: https://forms.gle/Pn3mL73kHLn4VEZ66 and we will arrange a slot for you in the schedule. Nuggets should be 100–300 words long and include a figure/animation. Please get in touch!
If you have any issues with the form, please contact This email address is being protected from spambots. You need JavaScript enabled to view it..
Electron Bulk Heating At Saturn’s Magnetopause
By Matthew Cheng (University College London)
The magnetopause (MP) boundary is formed by the solar wind plasma flow interacting with a planetary magnetic field. Magnetic reconnection is an important process at this boundary as it energises plasma via release of magnetic energy. This process can lead to an “open” magnetosphere allowing solar wind and magnetosheath particles to directly enter the magnetosphere. At Saturn, the nature of MP reconnection remains unclear. Masters et al. (2012) hypothesised that viable reconnection under a large difference in plasma β across the MP also requires a high magnetic shear (i.e. magnetic fields either side of the boundary close to anti-parallel).
We used electron bulk heating (i.e. the scalar temperature change) at magnetopause crossings to test hypotheses about reconnection at open magnetopause locations, and the influence of magnetic shear and plasma β. The bulk temperature was determined using three different methods, related to properties of the observed energy distribution (including methods from Lewis et al. 2008). We compared the observed heating of magnetosheath electrons with the prediction based on reconnection, using the semi-empirical relationship proposed by Phan et al. (2013) which relates the degree of bulk electron heating to the inflow Alfven speed. Figure 1 shows that Δβ-magnetic shear parameter space discriminates well between events with evidence of energisation (right) and those without (left). Based on the magnetic shear measured locally by the spacecraft either side of the MP, we find 81% of events with no energisation were situated in the ‘reconnection suppressed’ regime, and up to 68% of events with energization lay in the ‘reconnection possible’ regime. These findings support the hypotheses that magnetic shear and plasma β play a role in the viability of magnetic reconnection.
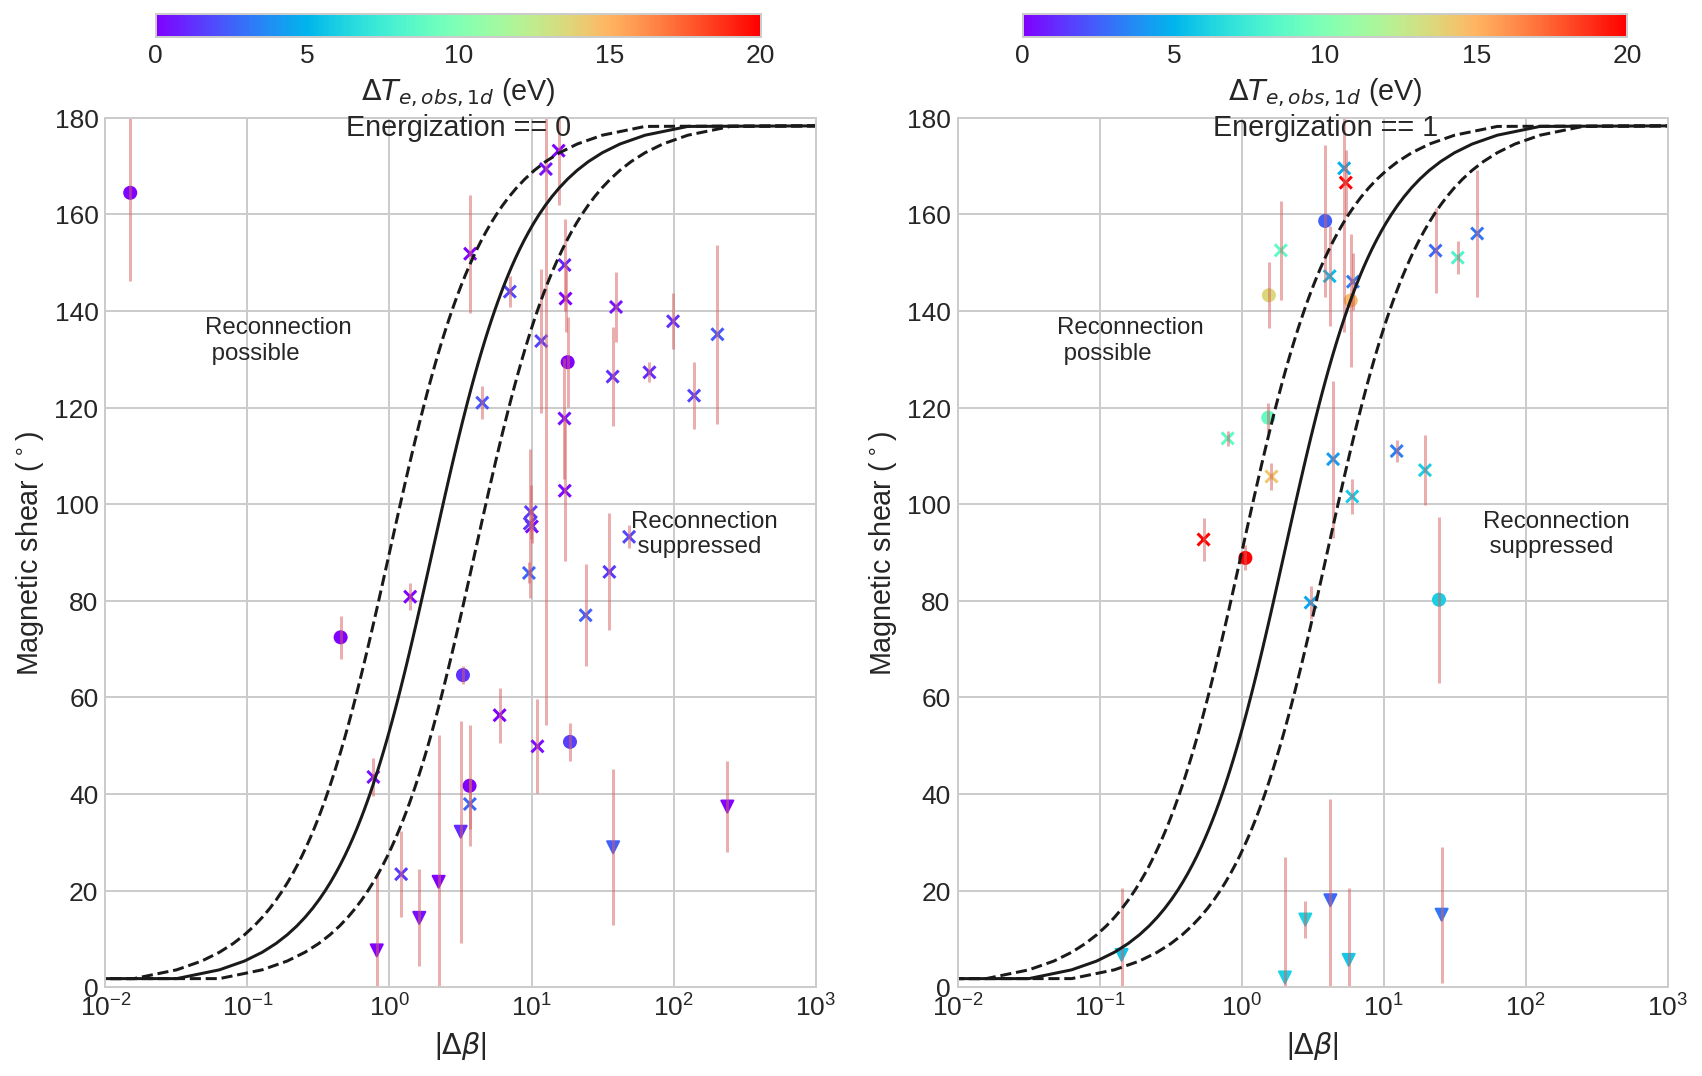
Figure 1. Assessment of diamagnetic suppression of reconnection, overlaid with electron heating ΔTe. The left and right panels show events without and with evidence of energization respectively.
Please see the paper for full details:
, , , , , & (2021). Electron Bulk Heating at Saturn’s Magnetopause. Journal of Geophysical Research: Space Physics, 126, e2020JA028800. https://doi.org/10.1029/2020JA028800
Comparing electron precipitation fluxes calculated from pitch angle diffusion coefficients to LEO satellite observations
By Jade Reidy (British Antarctic Survey)
Trapped radiation belt particles can be pitch angle scattered into the loss cone by resonant wave-particle interactions and atmospheric collisions. This high-energy electron input into our atmosphere can affect the atmospheric chemistry and is a significant loss mechanism of particles from the radiation belts, which themselves pose a threat to satellites. Reidy et al (2021) calculates the precipitating flux that would be measured inside the field of view of an electron detector on board a low earth orbiting satellite (POES) using wave particle theory and compares to in-situ data. These calculations depend on diffusion coefficients for whistler mode chorus waves, plasmaspheric hiss waves and atmospheric collisions. The diffusion coefficients used in Reidy et al (2021) were derived for use in the British Antarctic Survey Radiation Belt Model (BAS-RBM). The analysis presented in this paper is a direct test of the how well the diffusion coefficients used in the BAS‐RBM are able to quantify the precipitating flux and therefore a first step toward testing the loss due to precipitation within the BAS‐RBM itself.
Figure 1 shows a global plot of the linear correlation between the calculated precipitating flux and that measured by the POES T0 >30 keV electron channel between 26–30 March 2013. Our results show the best correlation on the dawnside for L* > 5; this agreement is consistent with chorus waves being the dominant scattering mechanism in this MLT and L-shell zone, suggesting that chorus-driven scattering is well represented in the BAS-RBM. However, we consistently underestimate the precipitating flux on the duskside, suggesting we are likely missing some diffusion here; potential causes of this underestimate are discussed in the paper. Reidy et al (2021) also demonstrates the potential of using wave particle theory to reconstruct the total precipitating flux over the entire loss cone, some of which is missed by the POES detector due to its limited field of view, finding that the total precipitating flux can exceed that measured by POES by a factor of 10.
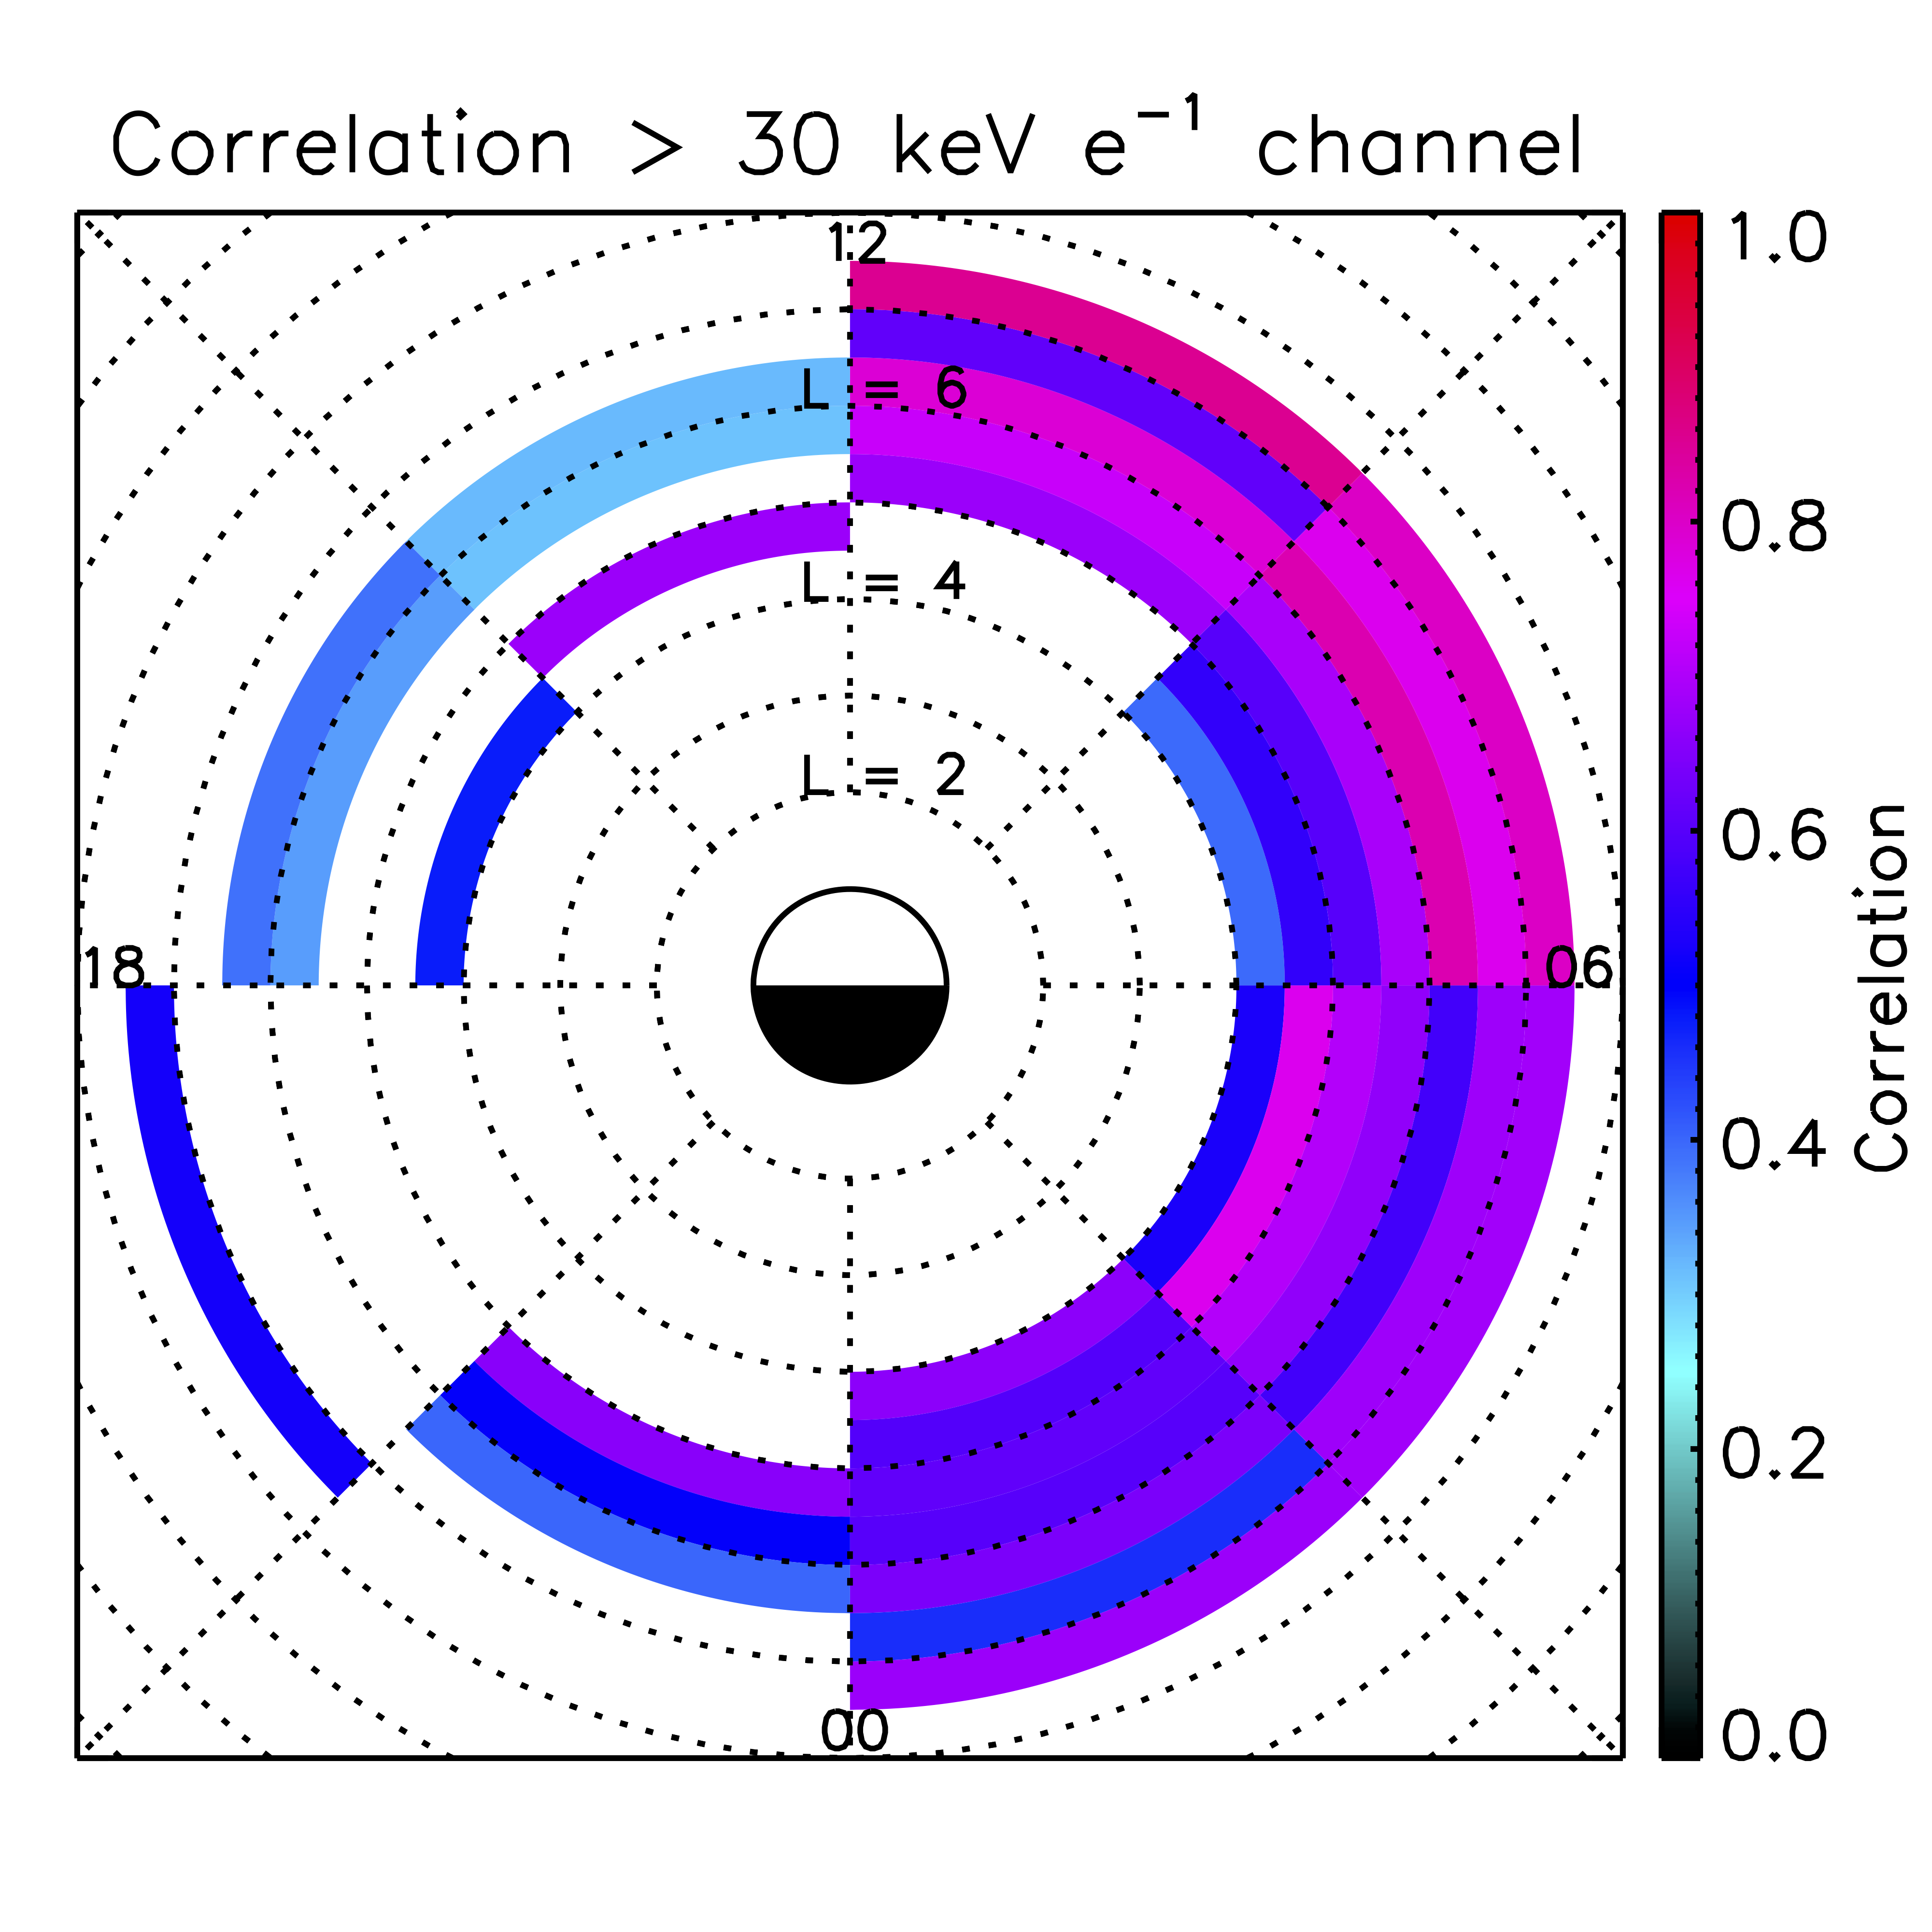
Figure 1: Linear correlation coefficient between calculated and measured precipitating flux in bins of 3 hour MLT and 0.5 L*, where noon is to the top and dawn to the right. The correlation is only shown where the confidence level is over 95%.
Please see the paper for full details:
, , , , , , et al. (2021). Comparing electron precipitation fluxes calculated from pitch angle diffusion coefficients to LEO satellite observations. Journal of Geophysical Research: Space Physics, 126, e2020JA028410. https://doi.org/10.1029/2020JA028410
Simultaneous Observation of an Auroral Dawn Storm with the Hubble Space Telescope and Juno
By Ben Swithenbank-Harris (University of Leicester)
Jupiter’s dawn storms are bright enhancements of the dawn flank of the main auroral emission, and produce the most powerful auroral events in the Solar System. These events have been observed numerous times with the Hubble Space Telescope (HST), and more recently by the Juno spacecraft, but their exact origins and related magnetospheric dynamics are not fully understood. For example, although consistent observations of this phenomena near local dawn suggested a relationship with the impinging solar wind, previous studies have shown no correlation between storm occurrence and solar wind conditions. Additionally, prior to the arrival of the Juno spacecraft at Jupiter in July 2016, auroral observations of dawn storms had not been supported by magnetospheric data from spacecraft in the dawn magnetosphere.
In this work, we present the first simultaneous magnetospheric in situ and auroral observations of the onset of a dawn storm. Magnetometer readings reveal brief reversals in the azimuthal magnetic field and decreases in the radial and total field magnitudes around the time of storm onset (Figure 1a-d). Furthermore, concurrent JADE (Figure 1e-h) and JEDI (Figure 1k-n) particle measurements reveal an increase in high energy particle populations and acceleration of magnetospheric protons towards corotational speeds, as well as long-lived hot plasma populations which persist in the outer magnetosphere beyond the expected lifetime of the enhanced auroral emissions. Ultimately, we associate this dawn storm with significant plasma heating and acceleration following reconnection at earlier local times.
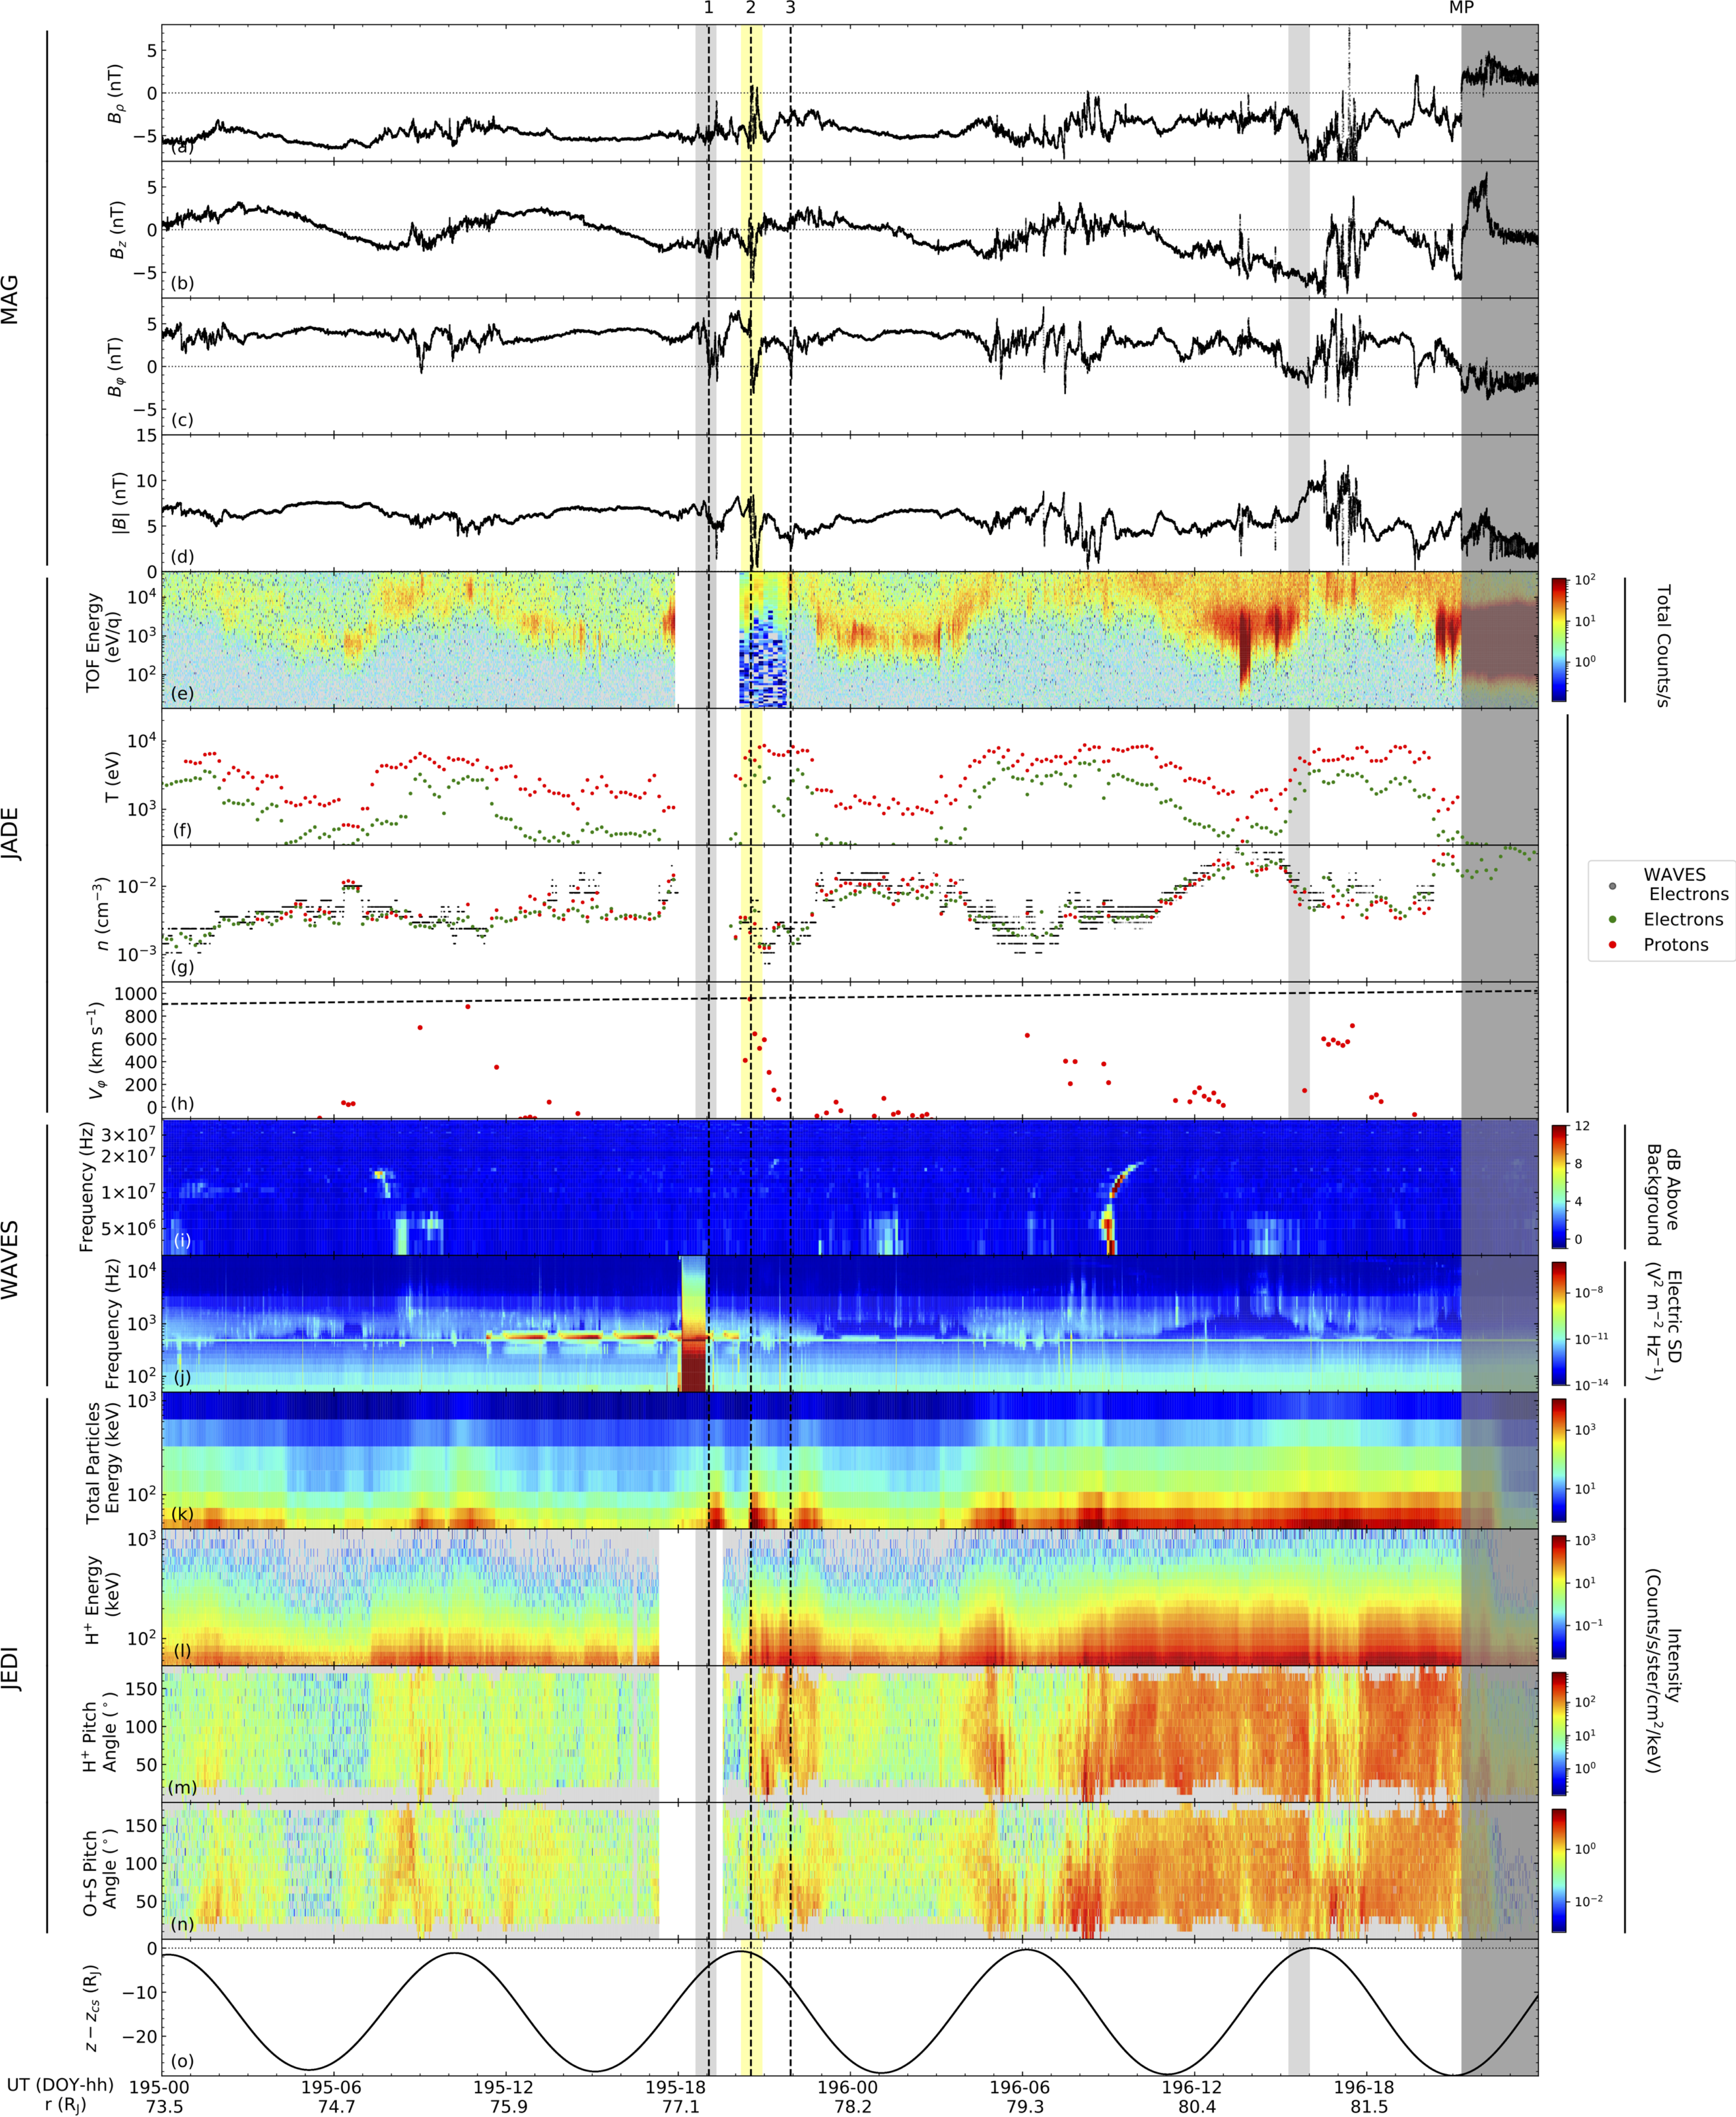
Figure 1: Overview of the Juno in situ data, showing (1a-d) the radial, north-south, azimuthal and total magnetic field strength (nT) in cylindrical polar coordinates, (1e-h) the JADE ion time-of-flight energy spectra, electron and proton temperatures (K), number densities (cm-3) and proton azimuthal velocities (km s-1), (1i-j) Waves high frequency and electric field continuum emissions, (1k-n) JEDI particle spectra showing the total particle and proton energies (k-l) and the proton and heavy ion pitch angle distributions (m-n), (1o) and the expected spacecraft distance from the centre of the current sheet (RJ), calculated using the method of Khurana (1992). The light grey shaded regions show the times of HST observations, with the dawn storm interval denoted by the yellow shaded region. The darker grey shading denotes a magnetopause crossing, and the three dotted vertical lines mark the times of several successive reversals in the azimuthal magnetic field.
Please see the paper for full details:
Swithenbank‐Harris, B.G., Nichols, J.D., Allegrini, F., Bagenal, F., Bonfond, B., Bunce, E.J., et al. (2021). Simultaneous Observation of an Auroral Dawn Storm with the Hubble Space Telescope and Juno. Journal of Geophysical Research: Space Physics, 126, e2020JA028717. https://doi.org/10.1029/2020JA028717
Pro‐L* ‐ A probabilistic L* mapping tool for ground observations
By Rhys Thompson (University of Reading)
Both ground and space observations are used extensively in the modeling of space weather processes within the Earth's magnetosphere. The shape of the magnetic field is not fixed, however, and there is not a consistent relationship between the footprint location of a ground measurement and its respective position in space. With no way to validate the global true magnetic field, numerous models exist to approximate it, allowing a subset of locations on the ground (mainly sub‐auroral) to be mapped along field lines to a location in space.
We often envision the radiation belts in a fixed coordinate system representative of the motions of the trapped particles. Often considered a proxy for distance is L*, a quantity related to the radial motion of electrons. Once an observation's respective location in the magnetic field is approximated it can be transformed into L*, provided the electrons at the measurement's physical location remain trapped by the Earth’s magnetic field.
Dependency of L* on magnetic field model accuracy is therefore paramount, however these models can significantly disagree on mapped L* values for a single point on the ground, during both quiet times and storms.
We present a state‐of‐the‐art tool, Pro‐L*, which for any ground observation provides the probabilities of corresponding L* values. Usage is highlighted for both event studies (a simple demonstration can be seen in Figure 1) and statistical models, and we demonstrate a number of potential applications. Pro-L* may be accessed as a freely available Python package at https://github.com/Rhyst223/pro-lstar.git.
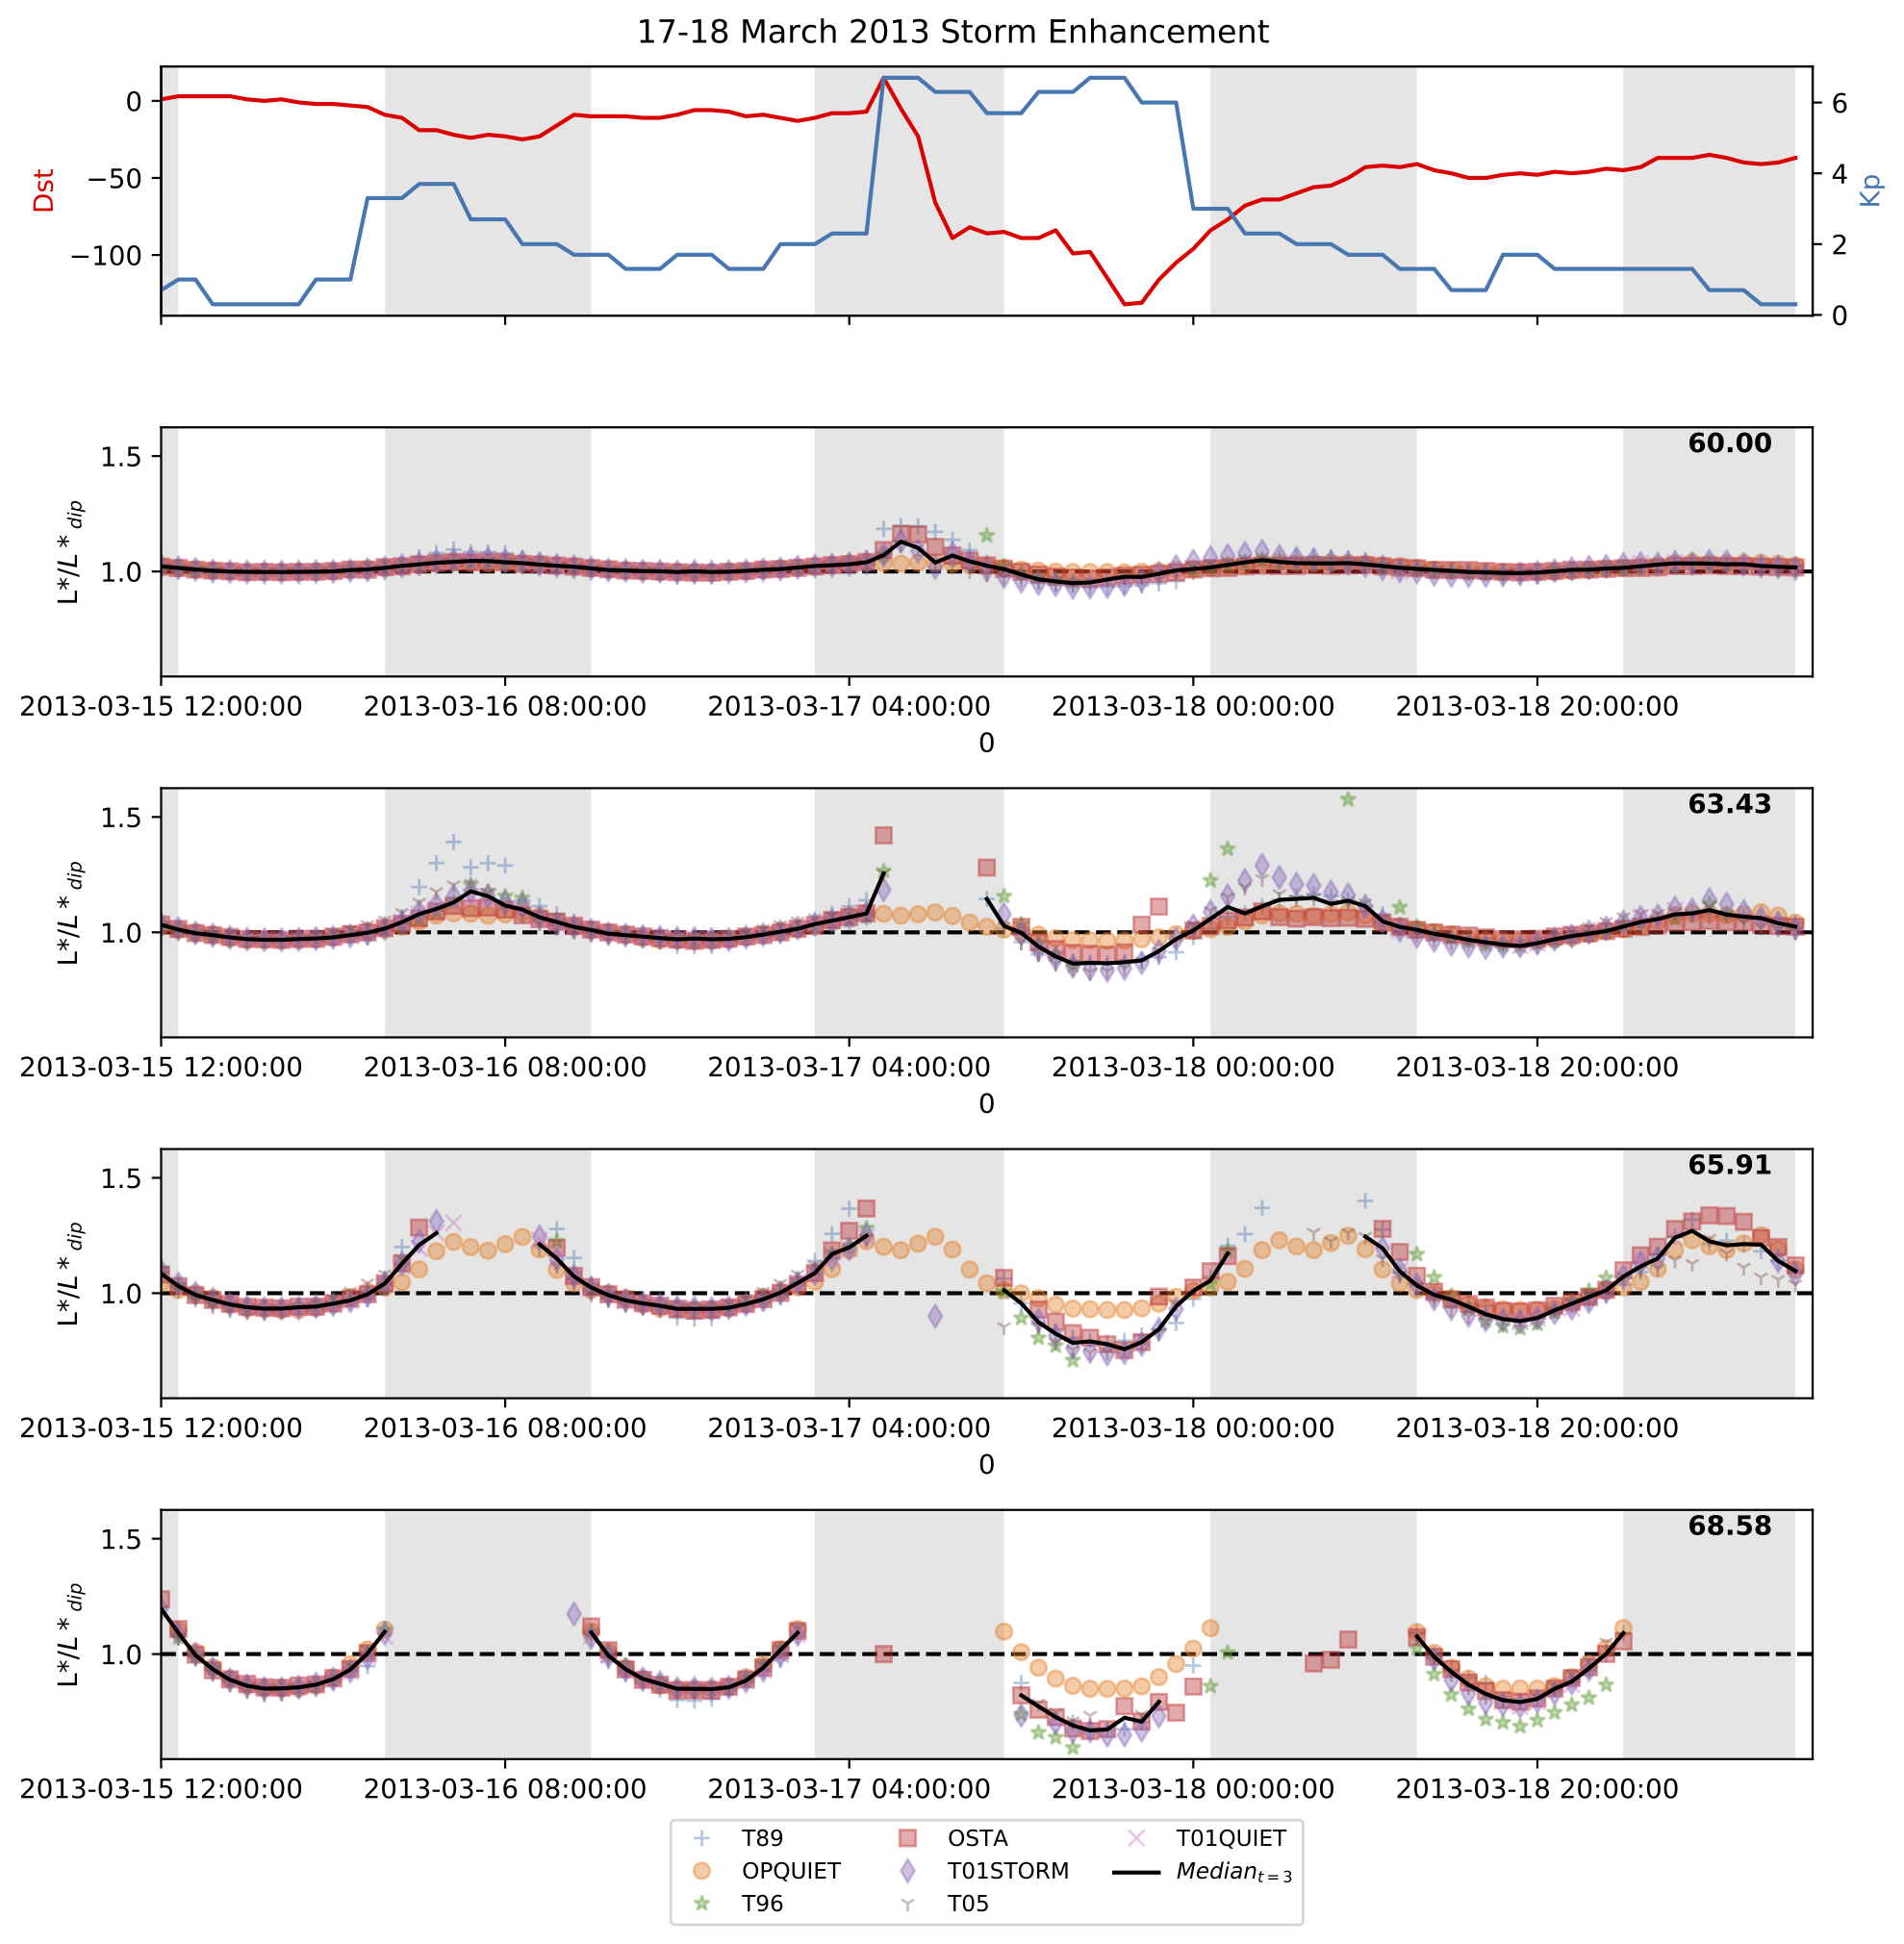
Figure 1: The L* response of magnetic field models to the 17-18 March 2013 storm enhancement, for a selection of magnetic latitudes at 330 degrees magnetic longitude, where ground observations are frequently of interest. The median probabilistic L* is also given provided that at least 3 magnetic field models return an L* value. All returned L* are normalised by their respective constant dipole approximation for comparison of latitudes on the same scale. The Dst and Kp indices are also provided over the given time period. Shaded bars indicate times where observed values are on the nightside.
Please see the paper for full details:
Thompson, R. L., Morley, S. K., Watt, C. E. J., Bentley, S. N., & Williams, P. D. (2020). Pro‐L* ‐ A probabilistic L* mapping tool for ground observations. Space Weather, 18, e2020SW002602. https://doi.org/10.1029/2020SW002602
Comparative Analysis of the Various Generalized Ohm’s Law Terms in Magnetosheath Turbulence as Observed by Magnetospheric Multiscale
By Julia E. Stawarz (Imperial College London)
Complex, highly nonlinear, turbulent dynamics play an important role in particle acceleration and plasma heating throughout the Universe by transferring energy from large-scale to small-scale fluctuations that can be more easily dissipated. Electric fields (E) in these plasmas are responsible for mediating energy exchange between the magnetic fields and particle motions and, therefore, can provide key insight into both the nonlinear dynamics of the turbulence and the processes responsible for dissipating the fluctuations. In the collisionless plasmas often found in space, E is described by generalized Ohm’s law, displayed in Fig. 1.
In Stawarz et al. (2021), we directly measure nearly all the terms in generalized Ohm’s law for several intervals in Earth’s magnetosheath and, for the first time, examine how Ohm’s law shapes the turbulent E at different length scales. Many terms in Ohm’s law, require the computation of small-scale gradients, and, therefore, the unique high-resolution, multi-spacecraft measurements from NASA’s Magnetospheric Multiscale mission were necessary to perform the study. As seen in Fig. 1, we find that, at scales larger than the proton inertial length, the observed E is given by the ideal magnetohydrodynamic term, while, at sub-proton scales, a combination of the Hall and electron pressure terms control E, as expected. Other terms, related to the difference between proton and electron inertia and the finite mass of electrons, remain small across the observable scales. Within the paper, we explore the interplay of the various terms in further detail by examining the correlation between the Hall and electron pressure terms, which provides insight into the types of sub-proton-scale structures formed, and by exploring the relative contribution of linear and nonlinear terms in Ohm’s law at different scales.
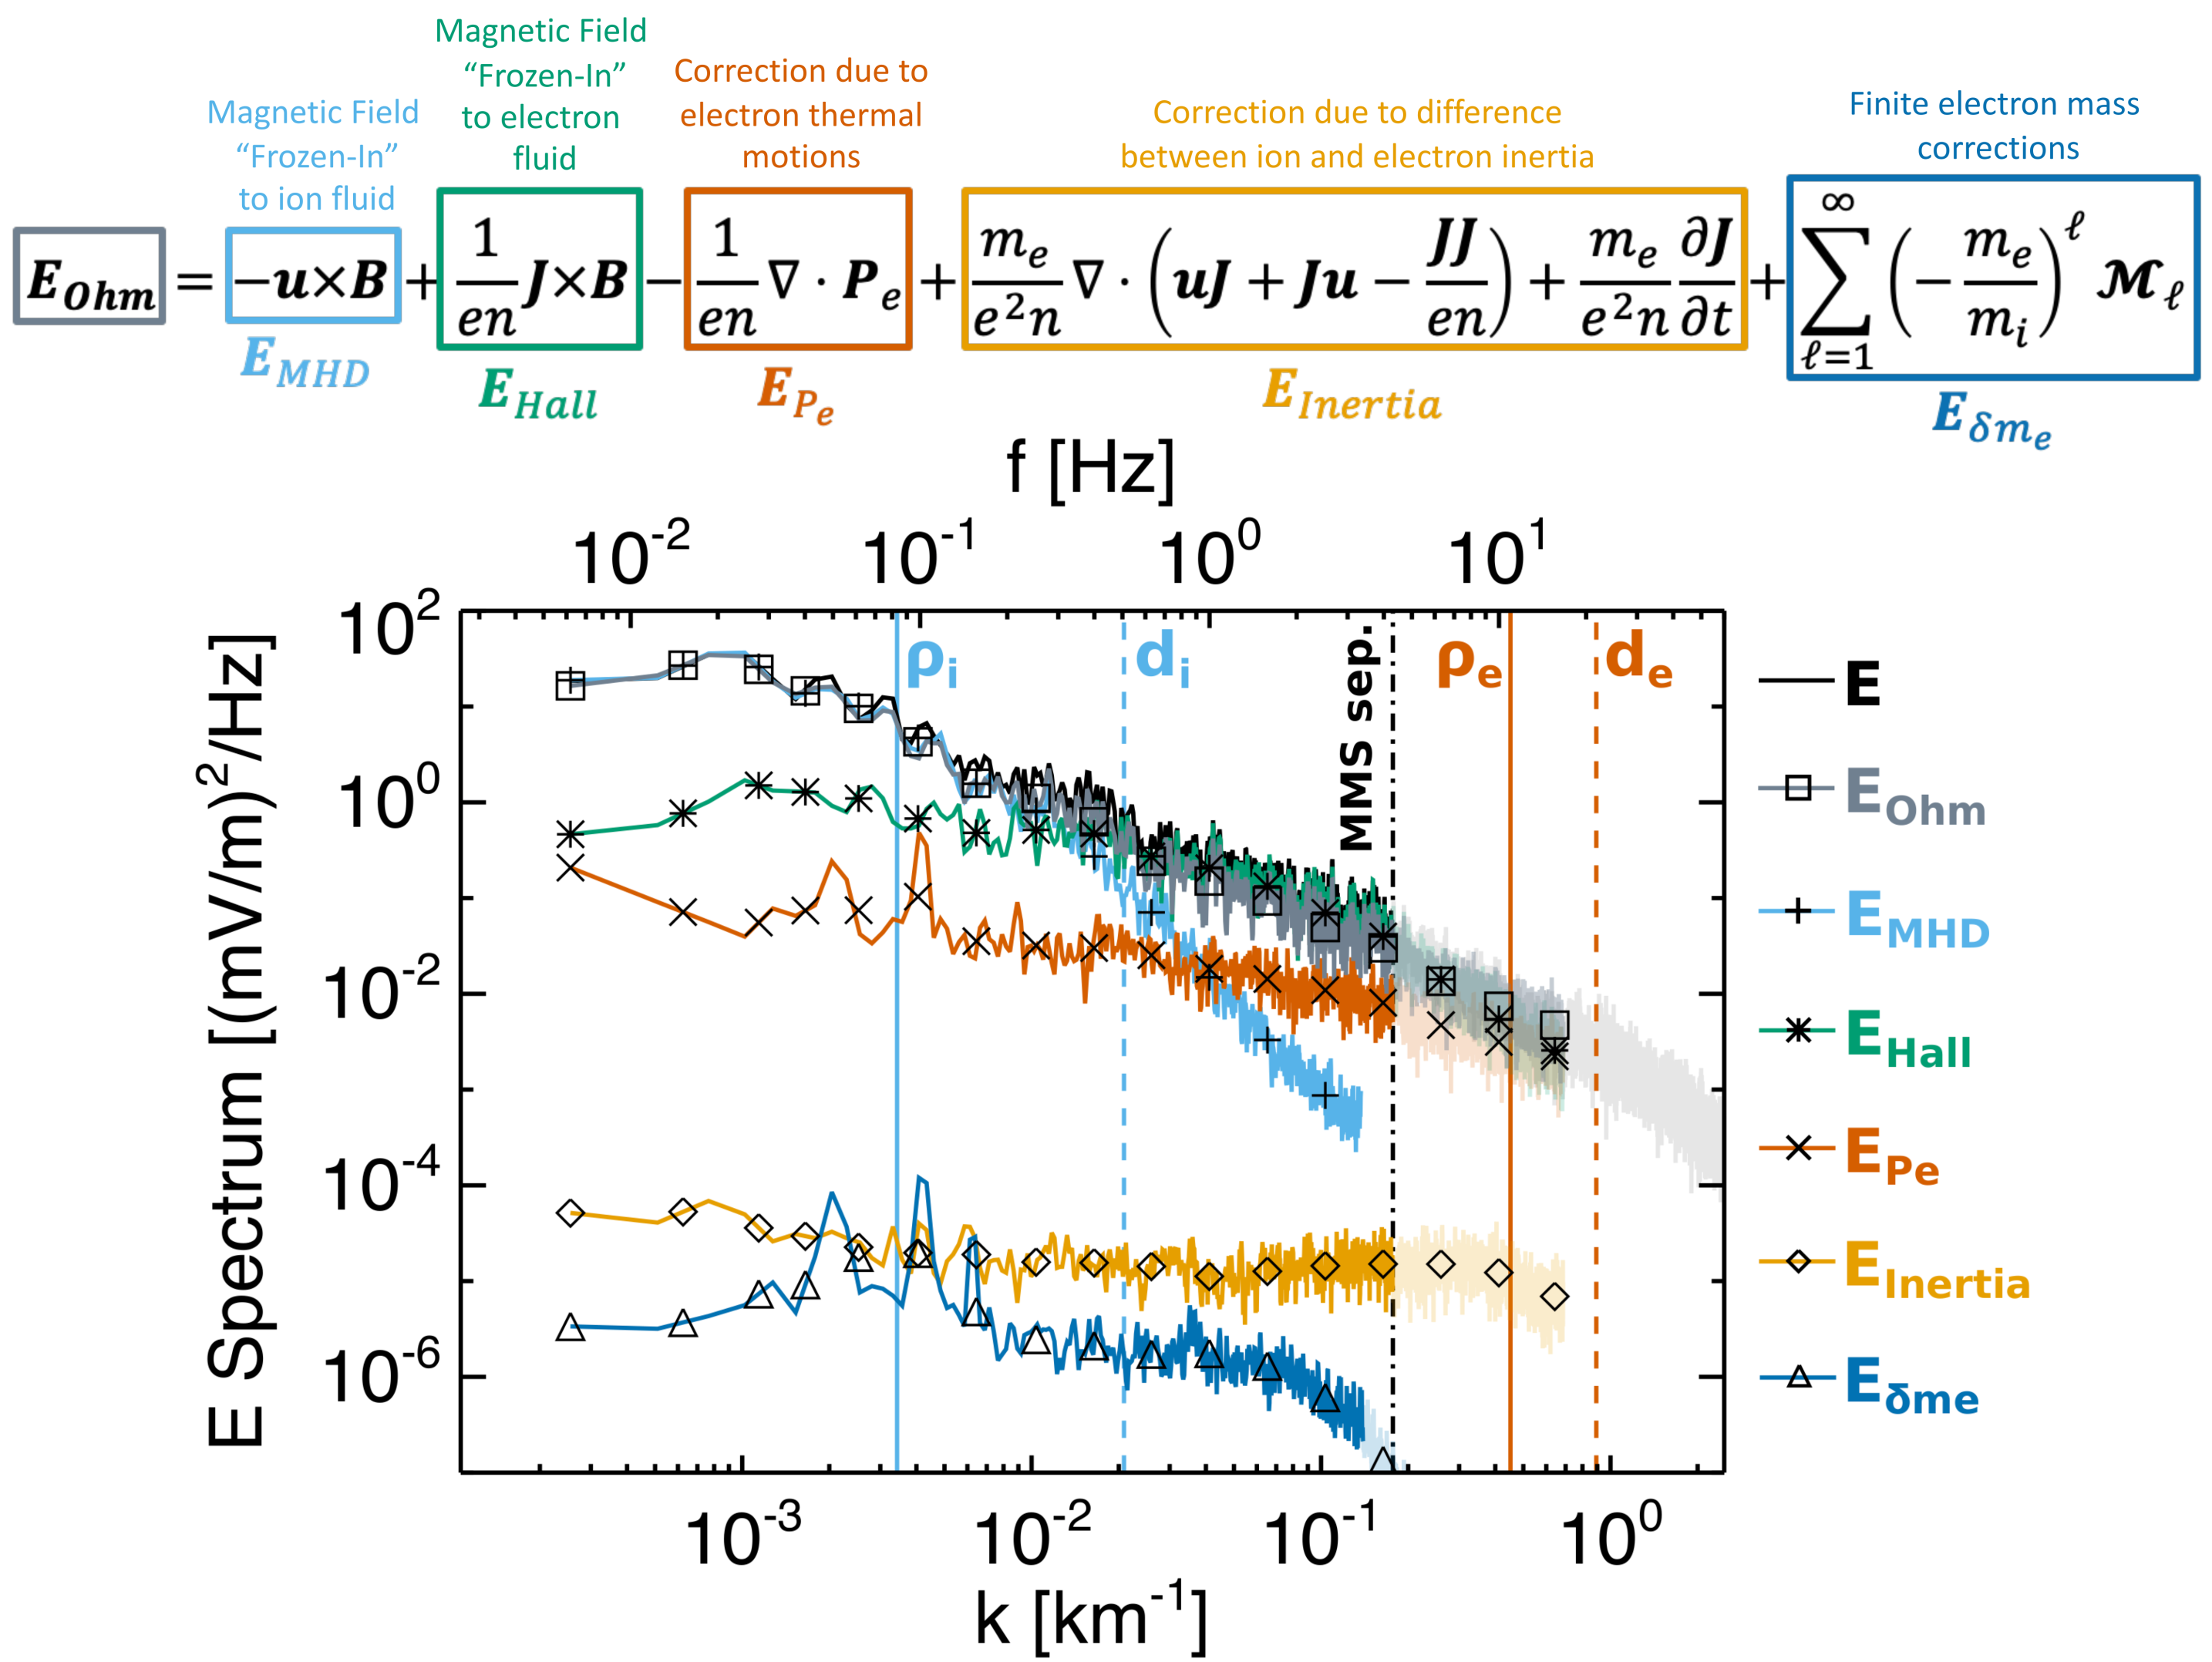
Fig.1: (Top) Generalized Ohm’s law for a collisionless, two species plasma, highlighting the different dynamical effects that can support E. (Bottom) Spectra of the terms in Ohm’s law and the observed E for an interval of turbulence in Earth’s magnetosheath. Vertical lines denote the proton and electron gyroradii (ρi/e), inertial lengths (di/e), and spacecraft formation size.
Please see the paper for full details:
J. E. Stawarz, L. Matteini, T. N. Parashar, L. Franci, J. P. Eastwood, C. A. Gonzalez, I. L. Gingell, J. L. Burch, R. E. Ergun, N. Ahmadi, B. L. Giles, D. J. Gershman, O. Le Contel, P.-A. Lindqvist, C. T. Russell, R. J. Strangeway, and R. B. Torbert (2021). Comparative Analysis of the Various Generalized Ohm’s Law Terms in Magnetosheath Turbulence as Observed by Magnetospheric Multiscale. J. Geophys. Res., 126, e2020JA028447, doi:10.1029/2020JA028447.