MIST
Magnetosphere, Ionosphere and Solar-Terrestrial
Nuggets of MIST science, summarising recent papers from the UK MIST community in a bitesize format.
If you would like to submit a nugget, please fill in the following form: https://forms.gle/Pn3mL73kHLn4VEZ66 and we will arrange a slot for you in the schedule. Nuggets should be 100–300 words long and include a figure/animation. Please get in touch!
If you have any issues with the form, please contact This email address is being protected from spambots. You need JavaScript enabled to view it..
Random forest model of ultra‐low frequency magnetospheric wave power
By Sarah Bentley (Northumbria University)
Parameterised (statistical) models are being increasingly used in space physics, both as an efficient way to use large amounts of data and as an important step in real-time modelling, to capture physics on scales not incorporated in numerical modelling. We have used machine learning techniques to create a model for the power in ultra low frequency (1-15mHz, ULF) waves throughout Earth’s magnetosphere. Capturing the power in these global-scale waves is necessary to determine the energisation and transport of high energy electrons in Earth’s radiation belts, and the model can also be used to test how individual wave driving processes combine throughout the magnetosphere.
The model is constructed using ensembles of decision trees (i.e. a random forest). Each decision tree iteratively partitions the given parameter space into variable size bins to reduce the error in the predicted output values. These variable bins mitigate several difficulties inherent to space physics data (sparseness, interdependent driving parameters, nonlinearity) to produce an approximation of ULF wave power in our chosen parameter space: physical driving parameters (solar wind speed vsw, magnetic field component Bz and variance in proton number density var(Np)) and spatial parameters of interest (magnetic local time MLT, magnetic latitude and frequency band).
[frequency, latitude, component, MLT, vsw, Bz, var(Np)] → ULF wave power
It is not always possible to extract all physical processes from parameterised models such as this. Instead we suggest a hypothesis testing framework to examine the physics driving ULF wave power. This formalises the approach taken in full statistical surveys, beginning with dominant driving processes, testing how they manifest in the model, and then examining remaining power.
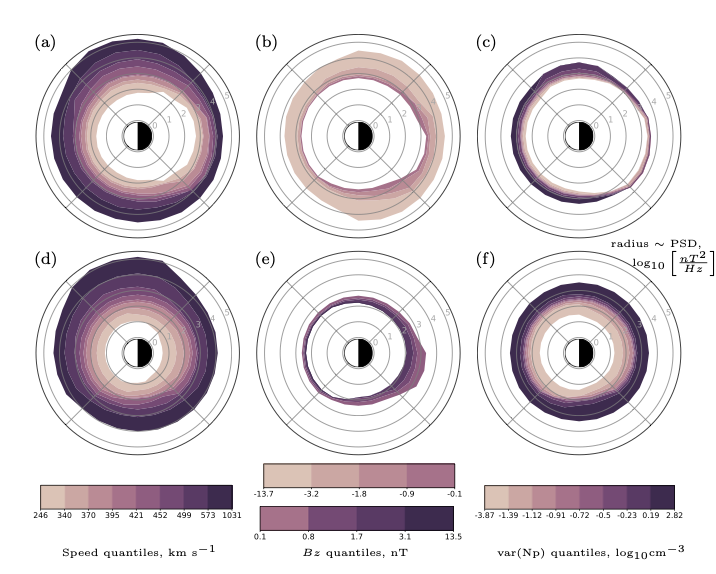
Figure 1: Variation of ULF wave power at one station, 5mHz. Model-predicted power spectral density is shown by magnetic local time at quantiles of (a) speed (for median Bz < 0 and var(Np)), (b) Bz < 0 (for median speed and var(Np)) and (c) var(Np) (for median speed and Bz < 0). Median values for speed, Bz < 0 and var(Np) are 421 km s−1, −1.8 nT and var(Np) = −0.716 log10(cm−3) respectively. (d)-(f) also show variation of wave power with speed, Bz and var(Np) but for Bz > 0 (with a median value of Bz = 1.7 nT held constant for (d) and (f)). Radius of each quantile corresponds to the power spectral density in log10(nT2/Hz) predicted for those solar wind values, at that station, frequency and magnetic local time.
In the paper we demonstrate how this method of iteratively considering smaller scale driving processes applies to magnetic local time asymmetries in ULF wave power. In Figure 1 we can see the wave power predicted by the model when we change one driving parameter and keep the others constant, for Bz<0 and Bz>0 separately. The MLT asymmetries in power clearly change with both driving parameter and there are two separate behaviour regimes for Bz>0, Bz<0. Digging deeper into these results using the framework, we conclude that
- The dawn-dusk wave power asymmetry is a combined effect of the different radial density profiles and wave driving from magnetopause (“external”) perturbations such as Kelvin-Helmholtz instabilities.
- We cannot account for the effects of a compressed magnetosphere, but var(Np) does not represent wave driving by magnetopause perturbations.
- Nor does Bz, which likely represents wave power increases with substorms.
We also found significant remaining uncertainty with mild solar wind driving, suggesting that the internal state of the magnetosphere should be included in future models.
Please see the paper for full details:
Bentley, S. N., Stout, J., Bloch, T. E., & Watt, C. E. J. (2020). Random forest model of ultra‐low frequency magnetospheric wave power. Earth and Space Science, 7, e2020EA001274. https://doi.org/10.1029/2020EA001274
Accounting for variability in ULF wave radial diffusion models
By Rhys Thompson (University of Reading)
The Van Allen outer radiation belt is a region in near‐Earth space containing mostly high‐energy electrons trapped by the Earth's geomagnetic field. It is a region populated by satellites that are vulnerable to damage from the high‐energy environment. Many modern outer radiation belt models simulate the long‐time behaviour of high‐energy electrons by solving a three‐dimensional Fokker‐Planck equation for the drift‐ and bounce‐averaged electron phase space density that includes radial, pitch‐angle, and energy diffusion.
Radial diffusion is an important process, driven by ultralow frequency (ULF) waves, where electrons are drawn from the outer boundary and accelerated toward Earth, or pushed away from the outer radiation belt and lost to interplanetary space. All of the physics is contained in the radial diffusion coefficient, DLL, often deterministically parameterized to provide a single output from the specified inputs which does not allow for any variability in the underlying ULF wave power.
We perform idealized numerical ensemble experiments on radial diffusion, introducing temporal and spatial variability to a widely used DLL, based on the median of statistical ultralow frequency (ULF) wave power for a particular geomagnetic index Kp, through stochastic parameterization constrained by statistical properties of its underlying observations. Results for one of the experiments is shown below in Figure 1. Our results demonstrate the sensitivity of radial diffusion over a long time period to the full distribution of the radial diffusion coefficient, highlighting that information is lost when only using median ULF wave power. A better understanding of temporal and spatial variations of ULF wave interactions with electrons, and being able to characterize these variations to a good level of accuracy, is vital to produce a robust description of radial diffusion over long timescales in the outer radiation belt.
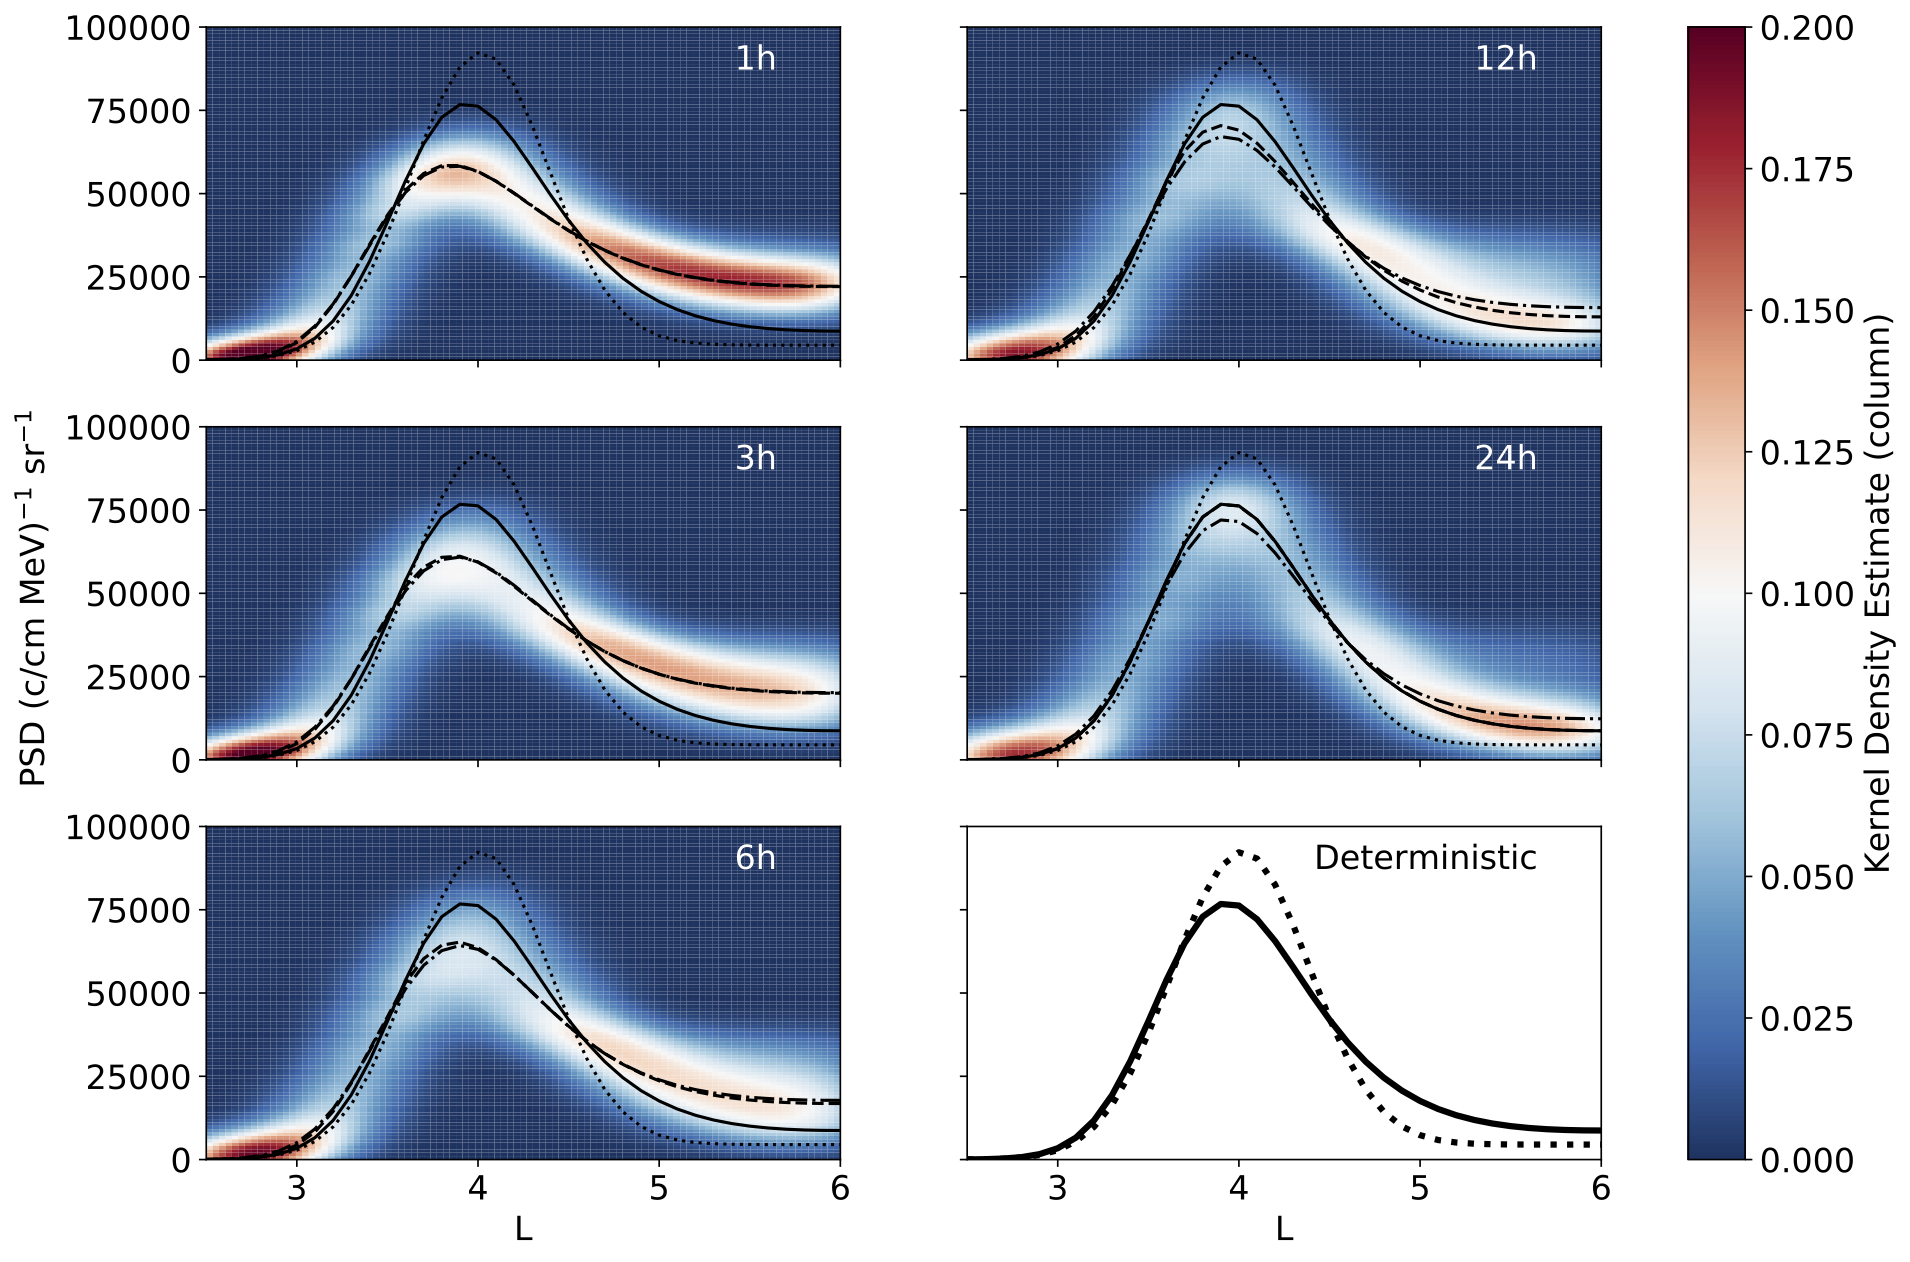
Figure 1: Ensemble results for the electron phase space density (PSD) at the end of a 2 day radial diffusion experiment, where ensemble DLL time series over the duration of the experiment are formulated by applying (lognormal) variability to a constant deterministic DLL (Kp=3) over a range of temporal variability scales (1, 3, 6, 12, and 24 hr, respectively). When variability is applied it persists until to the next hour of variability (relative to the temporal variability scale) where the process is repeated. The median (dashed), mean (dash‐dot) ensemble profiles are shown, as well as the initial PSD profile (dotted) and the deterministic solution with constant deterministic DLL (solid). Ensemble kernel density estimates of the resulting electron PSD are also shown.
Please see the paper for full details:
, , & (2020). Accounting for variability in ULF wave radial diffusion models. Journal of Geophysical Research: Space Physics, 125, e2019JA027254. https://doi.org/10.1029/2019JA027254
Multi‐scale observation of two polar cap arcs occurring on different magnetic field topologies
By Jade Reidy (University of Southampton & British Antarctic Survey)
Polar cap arcs (auroral arcs occurring at high latitudes) have been under debate since they were first discovered over 100 years ago. Although reports present conflicting evidence of the arcs forming on open field lines whilst others argue they are formed on closed field lines, recent work suggests that more than one polar cap arc formation mechanism potentially exists (e.g. Reidy et al., 2017, 2018).
Two events containing polar cap arcs occurring over Svalbard have been investigated using multiscale ground‐based and spacecraft instrumentation. Figures 1a and 2a show UV images from each event from the Special Sensor Ultra-Violet Imager (SSUSI) on board low-orbiting spacecraft (DMSP). These auroral images have been projected onto magnetic local time grids with noon at the top and dawn to the right. On both SSUSI images, we have projected an all sky camera image from Svalbard; this demonstrates how the ground-based and global-scale observations are related and allowed us to find an interval where the arc passes through the small field of view of the Auroral Structure and Kinetics (ASK) instrument (shown in Figures 1b and 2b for each event). Key features of each event are summarised below:
Event 1 – A Closed Event
- Electron and ion precipitation observed in both hemispheres.
- Highly dynamic small scale structure is observed (Figure 1b), similar to features in the main auroral oval.
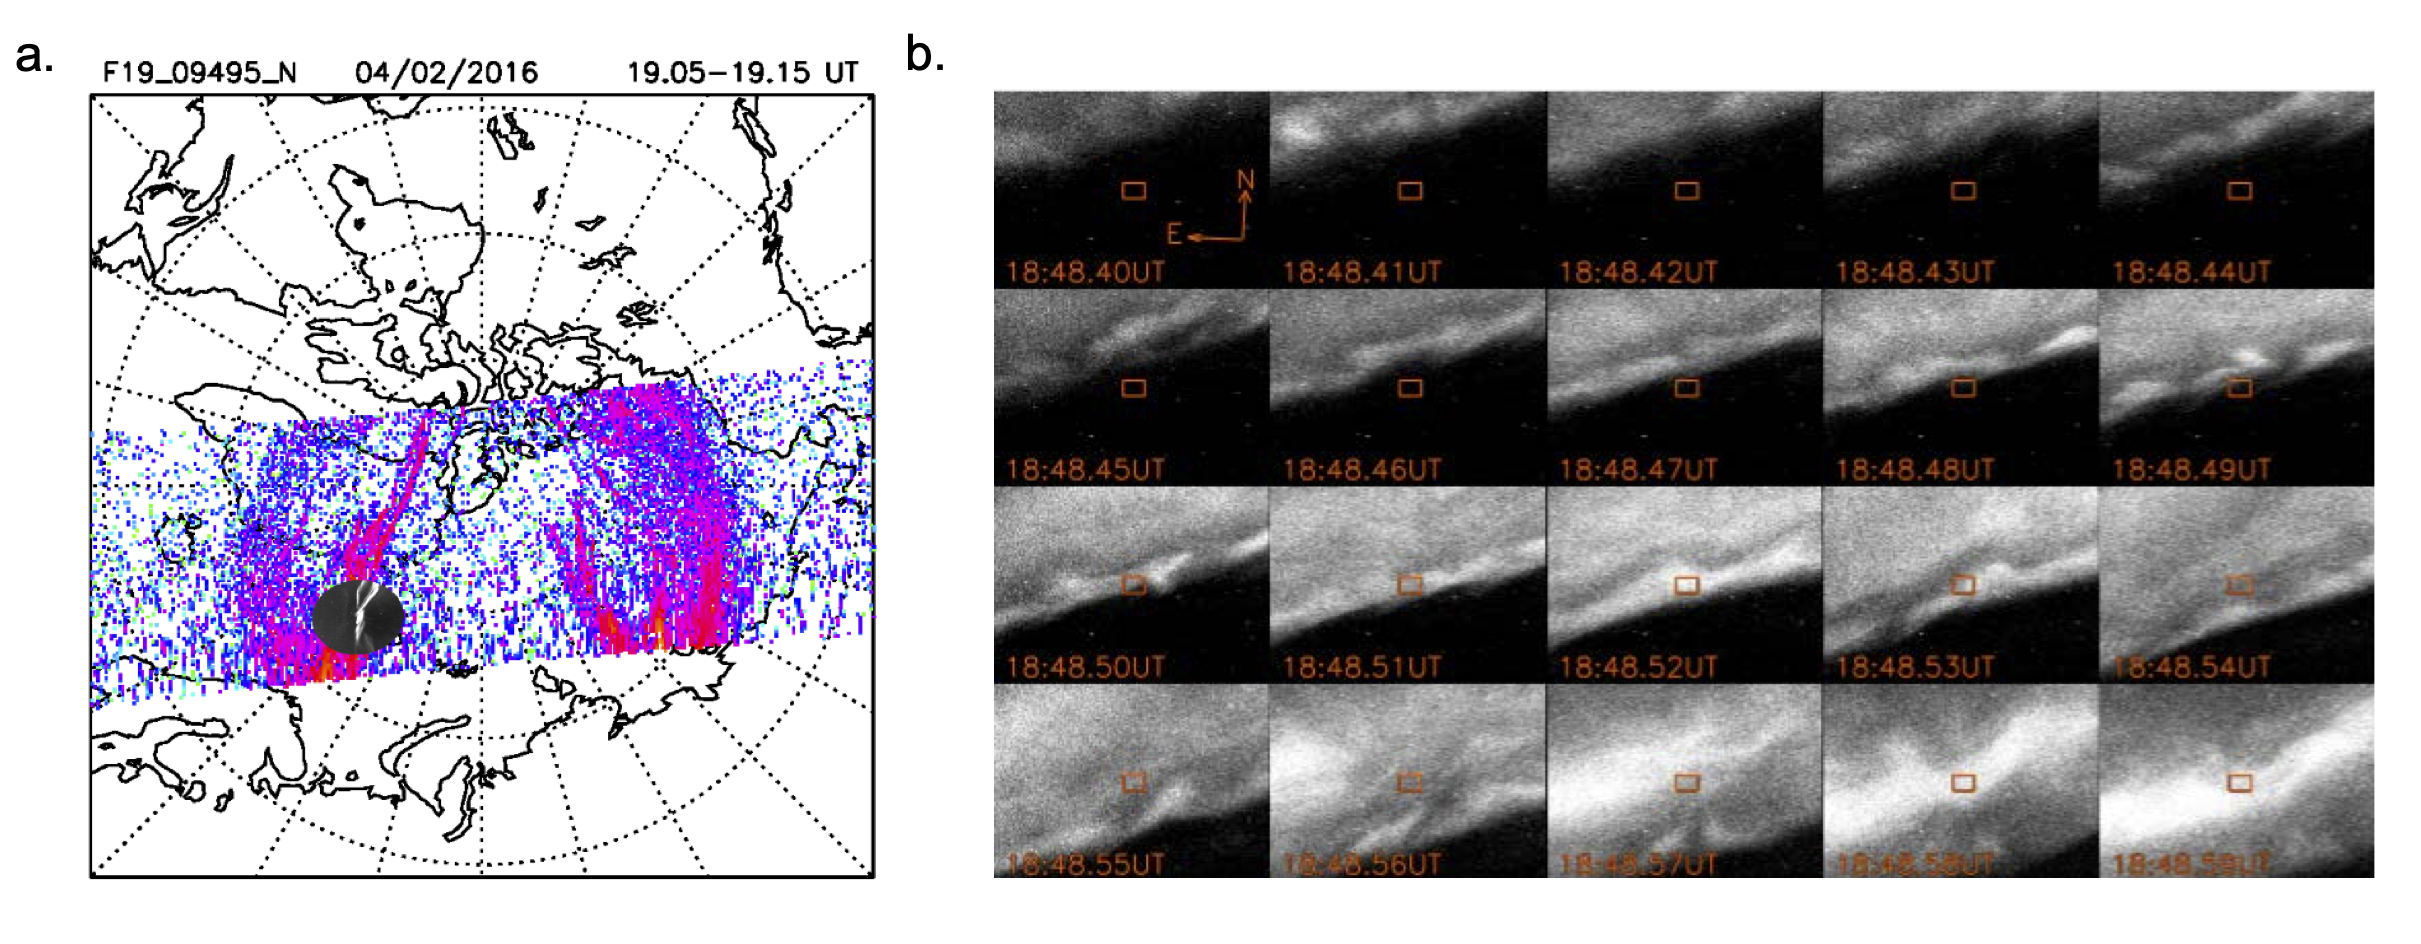
Figure 1: Observations of the polar cap arc occurring on 04 February 2016. (a) SSUSI and the all sky imager observations. (b) ASK instrument observations of the auroral arc.
Event 2 – An Open Event
- An electron-only particle signature.
- Very dim auroral features that are consistent with the low plasma density of the magnetotail lobes (Figure 2b).
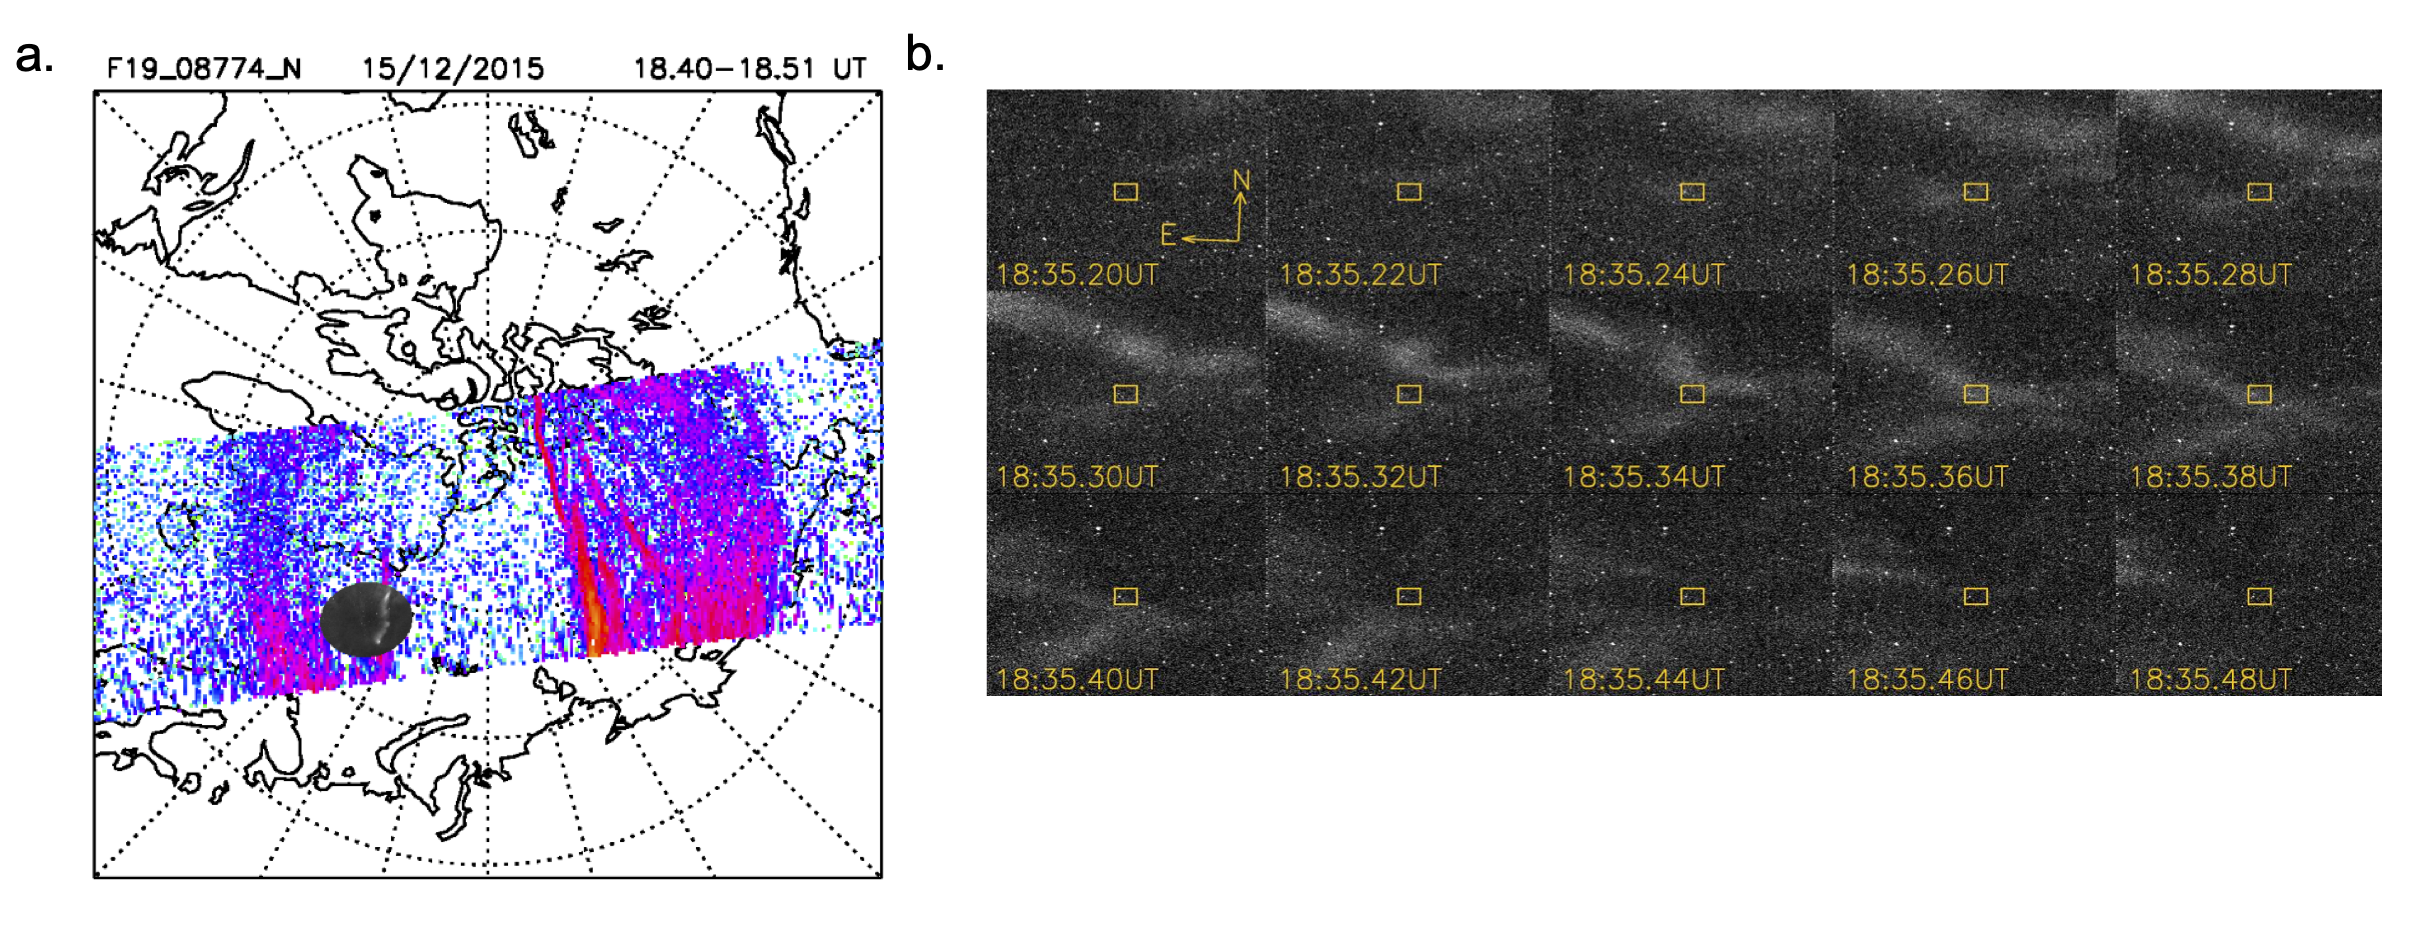
Figure 2: Observations of the polar cap arc occurring on 15 December 2015, in the same format as Figure 1.
In the full paper we investigate the different formation mechanisms further by comparing to observations from different instrumentation (including a ground-based spectrograph, located on Svalbard, and the Super Dual Auroral Radar Network). We conclude both events to be consistent with different and distinct formation mechanisms and that this is reflected in the small scale observations.
Please see the paper for full details:
Reidy, J. A., Fear, R. C., Whiter, D. K., Lanchester, B. S., Kavanagh, A. J., Price, D. J., et al. (2020). Multi‐scale observation of two polar cap arcs occurring on different magnetic field topologies. Journal of Geophysical Research: Space Physics, 125, e2019JA027611. https://doi.org/10.1029/2019JA027611
Dipole Tilt Effect on Magnetopause Reconnection and the Steady‐State Magnetosphere‐Ionosphere System: Global MHD Simulations
By Joseph Eggington (Imperial College London)
The Earth's dipole axis is tilted with respect to the Sun; the extent of this tilt, given by the ‘dipole tilt angle’, changes both diurnally and seasonally as the planet orbits and rotates. This introduces numerous variabilities in the coupled magnetosphere‐ionosphere system, such as altering the location and intensity of magnetic reconnection, allowing the tilt angle to strongly influence magnetospheric convection. In this study, we perform global magnetohydrodynamic (MHD) simulations of the steady‐state magnetosphere‐ionosphere system using the Gorgon MHD code. We drive the system with purely southward Interplanetary Magnetic Field (IMF) conditions for tilt angles from 0–90°, exploring hypothetical configurations beyond the actual extreme of ~30° to elucidate the underlying tilt angle dependence of the system. We identify the location of the magnetic separator (the 3-D reconnection X-line) with increasing tilt angle, showing how the shift of the separator southward on the magnetopause and the resulting changes in the reconnection rate lead to weaker and more time-dependent coupling with the solar wind at large tilt angles.
These trends map down to the ionosphere, with the polar cap contracting as the tilt angle increases, and the region I field‐aligned current (FAC) system migrating to higher latitudes with changing morphology. As shown in the Figure, the hinging of the magnetotail current sheet towards the equator in a tilted configuration results in a longer convection pathway for open field lines in the Northern hemisphere, as the reconnection site on the nightside is shifted more weakly than on the dayside. This introduces a North‐South asymmetry in magnetospheric convection, driving more FAC in the Northern ionosphere for large tilt angles than in the South independent of hemispheric differences in conductance. These results highlight the strong sensitivity to onset time in the potential impact of a severe space weather event, since the intensity of stormtime FACs at a given location on the ionosphere will depend closely on the orientation of the dipole axis.
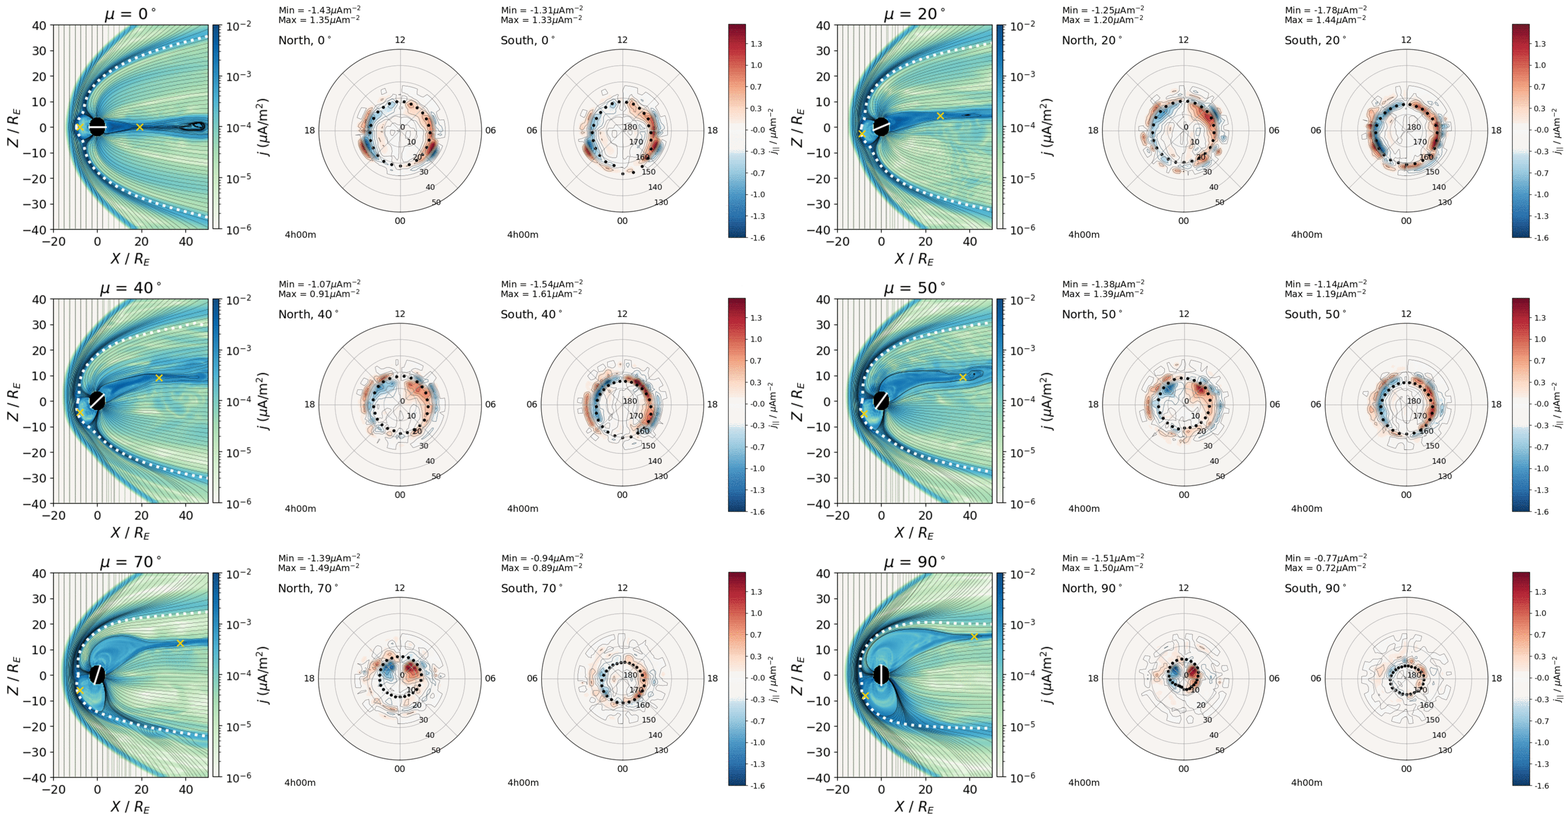
Figure: Animation of the effect of a changing dipole tilt angle on the magnetosphere-ionosphere system. The left panel shows a contour map of the magnetospheric current density in the noon-midnight meridian plane, with magnetic field lines in black. The orange crosses mark the approximate location of the dayside and nightside reconnection sites; the white dashed line shows the magnetopause location, and the solid white line represents the magnetic equator. The two right panels show contours of the FAC in the northern and southern ionosphere, with the open-closed boundary as a black dotted line.
Please see the paper for full details:
Eggington, J. W. B., Eastwood, J. P., Mejnertsen, L., Desai, R. T., & Chittenden, J. P. (2020). Dipole tilt effect on magnetopause reconnection and the steady‐state magnetosphere‐ionosphere system: Global MHD simulations. Journal of Geophysical Research: Space Physics, 125, e2019JA027510. https://doi.org/10.1029/2019JA027510
Statistics of Solar Wind Electron Breakpoint Energies Using Machine Learning Techniques
By Mayur Bakrania (Mullard Space Science Laboratory, UCL)
Solar wind electron velocity distributions at 1 au consist of a thermal 'core' population and two suprathermal populations: 'halo' and 'strahl'. The core and halo are quasi-isotropic, whereas the strahl typically travels along the parallel and/or anti-parallel direction with respect to the interplanetary magnetic field. The energies at which the halo and strahl populations are separated from the core population are known as the breakpoint energies, and these energies provide useful information on the relative importance of scattering mechanisms.
With Cluster-PEACE data, we analyse energy and pitch angle distributions and use machine learning techniques to separate and classify these solar wind populations. In our statistical study, we apply the K-means algorithm to phase space density distributions over ten years to study the variation of halo and strahl breakpoint energies with solar wind parameters. Key findings include:
- Halo and strahl suprathermal breakpoint energies increase with core temperature, with the halo exhibiting a more positive gradient than the strahl, as shown in the Figure. We conclude low energy strahl electrons are scattering into the core, instead of the halo. This increases the number of Coulomb collisions and extends the perpendicular core population to higher energies, resulting in a larger difference between halo and strahl breakpoint energies at higher core temperatures.
- Suprathermal breakpoint energies decrease with increasing solar wind speed. We also observe distinct profiles for fast and slow solar wind and conclude the origin of the solar wind, i.e., coronal holes for fast wind or streamer belt regions for slow wind, potentially plays a role in the definition of thermal and non-thermal electron populations.
This extensive and novel study reveals key characteristics of the solar wind electron populations. The results provide crucial information on the generation of solar wind electron populations as the solar wind propagates through the heliosphere.
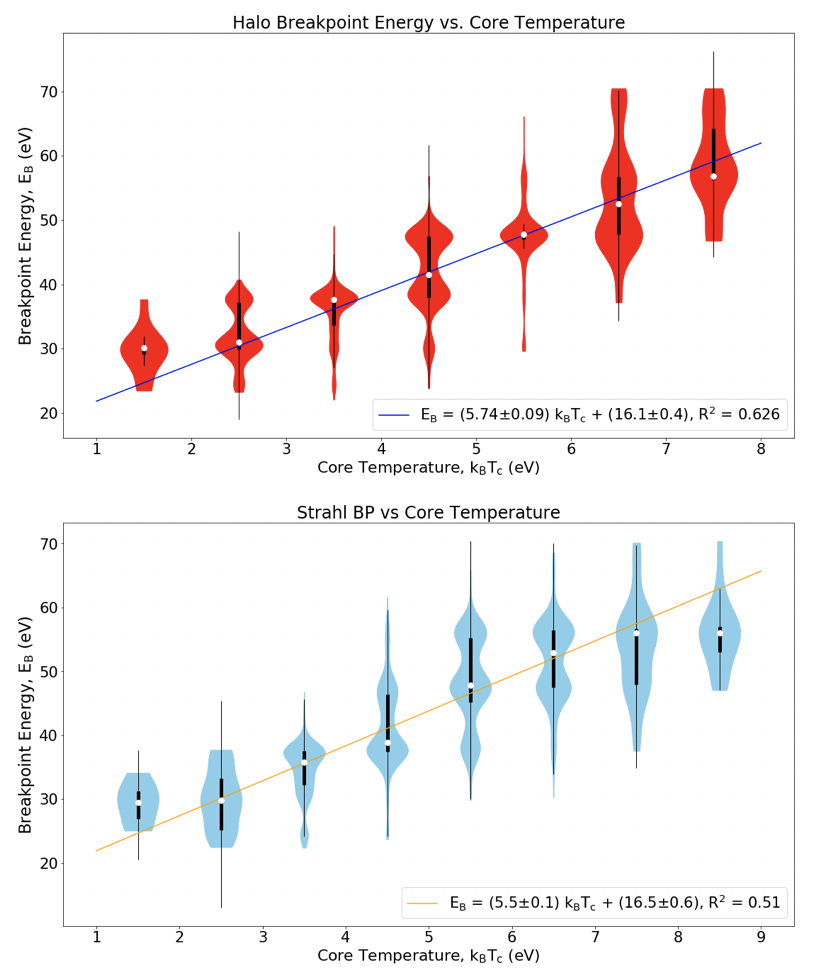
Figure. (Top) `Violin plot' of halo breakpoint energy against core temperature. The blue line shows the line of best fit. The white dots indicate the median of breakpoint energies and the thick black lines show the inter-quartile ranges (IQR). We plot the thin black lines to display which breakpoint energies are outliers. They span from Q3+1.5 X IQR to Q1-1.5 X IQR, where Q3 and Q1 are the upper and lower quartiles, respectively. The horizontal width of the red regions represents the density of data points at that given breakpoint energy. (Bottom) `Violin plot' of strahl breakpoint energy against core temperature. The orange line shows the line of best fit.
Please see the paper for full details:
Bakrania, M. R., Rae, I. J., Walsh, A. P., Verscharen, D., Smith, A. W., Bloch, T. & Watt, C. E. J. (2020). Statistics of solar wind electron breakpoint energies using machine learning techniques, A&A, 639, A46, https://doi.org/10.1051/0004-6361/202037840
