MIST
Magnetosphere, Ionosphere and Solar-Terrestrial
Latest articles
- Temporal Variability of Saturn's H2 Dayglow and Northern Aurora Observed by Hisaki and Cassini
- The Jupiter Auroral Ionosphere Code
- Analysis of Chorus Wave Power on Burst‐Mode Timescales During the Van Allen Probes Era
- Soft X-Ray Emission from Saturn's Magnetosheath II: Solar Wind Driving
- Which Kelvin-Helmholtz waves grow along the spatially-varying magnetopause flanks and why?
Latest news
Open Letter Ready For Signatories
Protect MIST Science! Sign the MIST Community Open Letter on the STFC funding cuts!
https://sites.google.com/view/uk-mist-community-open-letter
Statement from MIST Council regarding the STFC Funding Situation
Statement from MIST Council regarding the STFC Funding Situation
MIST Council is deeply concerned by the ongoing STFC funding uncertainty and its impact on our community and beyond.
The current combination of prospective delayed and reduced funding, together with already volatile financial situations at universities across the UK, is placing significant strain on research groups. In some cases, institutions may be unable to support researchers through gaps between projects, increasing precarity across the community and adding significant pressure on early-career researchers.
We are concerned that continued uncertainty risks accelerating a brain drain from the UK, as skilled researchers reconsider their future in a system offering limited stability. The loss of expertise at any career stage would have lasting consequences for UK space science.
What is going on?
For those that are unaware of the situation, it is complex and evolving. We suggest the following sources to get up to speed on the current developments.
https://ras.ac.uk/news-and-press/news/proposed-budget-cuts-catastrophe-uk-astronomy
What are we doing about it?
Behind the scenes, MIST Council is actively engaging with relevant parties to understand the scale of the challenge and to identify constructive ways forward.
- We are seeking seasoned members of the community to join MIST Council on a task force to help develop options and represent the needs of our community. If you would like to be involved, please reach out to us via the MIST Council email (This email address is being protected from spambots. You need JavaScript enabled to view it.) by the end of this week (13th February 2026).
- In addition to the task force, we want to provide an open forum for discussion and collective input among all members of the wider MIST community. We are exploring options and will be in touch as soon as possible with further details.
- We believe in working together in the face of the current challenges and we are collaborating with UKSP and others to strive for a fair and positive outcome for all. We are reaching out to members of the SSAP (Solar System Advisory Panel) to explore the hosting of a community town hall meeting, like the one already being organised by the AAP (Astronomy Advisory Panel), to provide an open forum for discussion and collective input.
What can you do to help?
There are several open letters representing people in various career stages that have been made available to sign. We encourage you to read the relevant letter(s) and to sign them if you support them:
- Fellowship Holders: https://advancedfellows-openletter-stfc.github.io/index.html
- Early Career Researchers: https://ecr-openletter-stfc.github.io/
The Royal Astronomical Society are also urging Fellows to lobby their MPs against the cuts, and have included a template letter that can be used to do so:
https://ras.ac.uk/news-and-press/news/ras-fellows-urged-lobby-against-unprecedented-cuts
MIST Council will continue to advocate for transparency, stability, and funding structures that recognise both the long-term nature of our science and the people who deliver it.
We thank you for your continued support in this period of uncertainty.
Please contact This email address is being protected from spambots. You need JavaScript enabled to view it. if you have further suggestions.
MIST Council
![]()
Announcement of New MIST Council 2025
We are very pleased to announce the following members of the community have been elected to MIST Council:
- Gemma Bower (University of Leicester), MIST Councillor
- Tom Elsden (University of St Andrews), MIST Councillor
- Cameron Patterson (Lancaster University), MIST Councillor
- Fiona Ball (University of Southampton), Student Representative
They will begin their terms in July 2025.
We thank outgoing MIST Council members: Maria Walach, Chiara Lazzeri and Emma Woodfield. Andy Smith will remain on council a little longer as a co-opted member to cover Rosie Johnson's maternity leave.
The current composition of Council can be found on our website (https://www.mist.ac.uk/community/mist-council).
Announcement of New MIST Councillors.
We are very pleased to announce the following members of the community have been elected unopposed to MIST Council:
- Rosie Johnson (Aberystwyth University), MIST Councillor
- Matthew Brown (University of Birmingham), MIST Councillor
- Chiara Lazzeri (MSSL, UCL), Student Representative
Rosie, Matthew, and Chiara will begin their terms in July. This will coincide with Jasmine Kaur Sandhu, Beatriz Sanchez-Cano, and Sophie Maguire outgoing as Councillors.
The current composition of Council can be found on our website, and this will be amended in July to reflect this announcement (https://www.mist.ac.uk/community/mist-council).
Nominations are open for MIST Council
We are very pleased to open nominations for MIST Council. There are three positions available (detailed below), and elected candidates would join Georgios Nicolaou, Andy Smith, Maria-Theresia Walach, and Emma Woodfield on Council. The nomination deadline is Friday 31 May.
Council positions open for nomination
2 x MIST Councillor - a three year term (2024 - 2027). Everyone is eligible.
MIST Student Representative - a one year term (2024 - 2025). Only PhD students are eligible. See below for further details.
About being on MIST Council
If you would like to find out more about being on Council and what it can involve, please feel free to email any of us (email contacts below) with any of your informal enquiries! You can also find out more about MIST activities at mist.ac.uk. Two of our outgoing councillors, Beatriz and Sophie, have summarised their experiences being on MIST Council below.
Beatriz Sanchez-Cano (MIST Councillor):
"Being part of the MIST council for the last 3 years has been a great experience personally and professionally, in which I had the opportunity to know better our community and gain a larger perspective of the matters that are important for the MIST science progress in the UK. During this time, I’ve participated in a number of activities and discussions, such as organising the monthly MIST seminars, Autumn MIST meetings, writing A&G articles, and more importantly, being there to support and advise our colleagues in cases of need together with the wonderful council members. MIST is a vibrant and growing community, and the council is a faithful reflection of it."
Sophie Maguire (MIST Student Representative):
"Being the student representative for MIST council has been an amazing experience. I have been part of organizing conferences, chairing sessions, and writing grant applications based on the feedback MIST has received. From a wider perspective, MIST has helped to grow and support my professional networks which in turn, directly benefits my PhD work as well. I would encourage any PhD student to apply for the role of MIST Student Representative and I would be happy to answer any questions or queries you have about the role."
How to nominate
If you would like to stand for election or you are nominating someone else (with their agreement!) please email This email address is being protected from spambots. You need JavaScript enabled to view it. by Friday 31 May. If there is a surplus of nominations for a role, then an online vote will be carried out with the community. Please include the following details in the nomination:
- Name
- Position (Councillor/Student Rep.)
- Nomination Statement (150 words max including a bit about the nominee and focusing on your reasons for nominating. This will be circulated to the community in the event of a vote.)
MIST Council details
- Sophie Maguire, University of Birmingham, Earth's ionosphere - This email address is being protected from spambots. You need JavaScript enabled to view it.
- Georgios Nicolaou, MSSL, solar wind plasma - This email address is being protected from spambots. You need JavaScript enabled to view it.
- Beatriz Sanchez-Cano, University of Leicester, Mars plasma - This email address is being protected from spambots. You need JavaScript enabled to view it.
- Jasmine Kaur Sandhu, University of Leicester, Earth’s inner magnetosphere - This email address is being protected from spambots. You need JavaScript enabled to view it.
- Andy Smith, Northumbria University, Space Weather - This email address is being protected from spambots. You need JavaScript enabled to view it.
- Maria-Theresia Walach, Lancaster University, Earth’s ionosphere - This email address is being protected from spambots. You need JavaScript enabled to view it.
- Emma Woodfield, British Antarctic Survey, radiation belts - This email address is being protected from spambots. You need JavaScript enabled to view it.
- MIST Council email - This email address is being protected from spambots. You need JavaScript enabled to view it.
Nuggets of MIST science, summarising recent papers from the UK MIST community in a bitesize format.
If you would like to submit a nugget, please fill in the following form: https://forms.gle/Pn3mL73kHLn4VEZ66 and we will arrange a slot for you in the schedule. Nuggets should be 100–300 words long and include a figure/animation. Please get in touch!
If you have any issues with the form, please contact This email address is being protected from spambots. You need JavaScript enabled to view it..
An Improved Estimation of SuperDARN Heppner-Maynard Boundaries using AMPERE data
By Alexandra R Fogg (University of Leicester)
The transport of magnetic flux through the terrestrial magnetosphere is communicated to the ionosphere, resulting in the circulation of plasma known as ionospheric convection. The Super Dual Auroral Radar Network (SuperDARN) measures the movements of ionospheric plasma, and its data can be assimilated into a global map of electrostatic potential, known as an ionospheric convection map. The low latitude boundary of the SuperDARN ionospheric convection region is known as the Heppner-Maynard Boundary (HMB). The determination of the latitude of the HMB depends on the availability of radar backscatter, which varies temporally and spatially.
In this study, the midnight meridian latitude of the HMB, Λ0, is compared with a scale size for the field-aligned current (FAC) region, from the Active Magnetosphere and Planetary Electrodynamics Response Experiment (AMPERE). Since both the convection and FAC regions are related to the polar cap boundary, the relationship between the scale sizes for the two systems could be expected to be linear, as both will expand and contract with the movement of the polar cap boundary. The midnight meridian latitude of the boundary between the Region 1 and Region 2 FACs, RF, is used to characterise the size of the FAC region.
In order to assess solar cycle variations, Λ0 and RF data were gathered from 2011 and 2015. After the application of some data selection criteria, linear regression analysis was performed on the two datasets, which are presented in Figure 1(a) and (b). There is a clear linear trend in the main cluster of data for both 2011 and 2015, and the resulting lines of best fit have gradients close to 1. As can be seen from Figure 1(c), in the areas of greatest occurrence for both years, the predicted values of Λ0 from the trends are very similar, although there are differences at the extremes of the dataset.
The results present a new reliable method of determining the latitude of the SuperDARN HMB from AMPERE RF measurements, where such predictions are independent of variations in radar backscatter availability.

Figure 1 (a) Occurrence of RF as a function of Λ0 for 2011 data, after some data selection criteria. Linear trend from the dataset is overplotted as a solid black line (1), and the equation is recorded at the top. Linear trend after the removal of some outliers is overplotted as a dashed black line (2). For both trends, the number of points in the dataset (N), correlation coefficient of the fit (r), percentage of points above and below (a and b) the line and RMS error (RMS) are recorded above and below the panel. (b) As for (a) but for 2015 data. (c) All four trends presented in (a) and (b) plotted together on a different scale.
For more information please see:
Fogg, A. R., Lester, M., Yeoman, T. K., Burrell, A. G., Imber, S. M., Milan, S. E., et al. (2020). An improved estimation of SuperDARN Heppner-Maynard boundaries using AMPERE data. Journal of Geophysical Research: Space Physics, 125, e2019JA027218. https://doi.org/10.1029/2019JA027218
Plasma density gradients at the edge of polar ionospheric holes: the absence of phase scintillation
By Luke Jenner (Nottingham Trent University)
The high-latitude ionosphere is a highly structured medium. Large-scale plasma structures with a horizontal extent of tens to hundreds of kilometres are routinely observed and it is well known that these can disrupt radio waves such as those used for Global Navigation Satellite System (GNSS). One such structure, a polar ionospheric hole, is a sharp depletion of plasma density. In this paper polar holes were observed in the high-latitude ionosphere during a series of multi-instrument case studies close to the Northern Hemisphere winter solstice in 2014 and 2015. These holes were observed during geomagnetically quiet conditions and under a range of solar activities using the European Incoherent Scatter (EISCAT) Svalbard Radar (ESR) and measurements from GNSS receivers. The edges of the polar holes were characterised by steep gradients in the electron density. Such electron density gradients have been associated with phase scintillation in previous studies; however, no enhanced scintillation was detected within the electron density gradients at these boundaries. It is suggested that the lack of phase scintillation may be due to low plasma density levels and a lack of intense particle precipitation. In a review paper Aarons (1982) suggested that a minimum density level may be required for scintillation to occur, and our observations support this idea. We conclude that both significant electron density gradients and plasma density levels above a certain threshold are required for scintillation to occur.

Figure: Electric potential patterns inferred from the SuperDARN radars for 17:14 UT on 17 December 2014 as a function of geomagnetic latitude and magnetic local time. Magnetic noon is shown at the top of panels with dusk and dawn on the left- and right-hand sides respectively and magnetic midnight at the bottom. Magnetic latitude is indicated by the grey dashed circular lines at 10.0◦ increments. The grey lines show the location of satellite passes from GNSS satellites, assuming an ionospheric intersection of 350 km. The SuperDARN plot from 17:14 UT plot includes satellite passes from 16:58 to 17:28 UT. These time intervals were chosen as the inspection of the whole SuperDARN data set at a 2 min resolution indicated that the convection patterns were relatively stable during these intervals. The panels on the right half show the area around the satellite passes in more detail. Colours represent phase scintillation in the top right panel and TEC in the bottom right panel. The thick black line indicates the position of the polar hole observed using the 42 m dish of the EISCAT Svalbard Radar.
For more information, please see the paper:
Jenner, L. A., Wood, A. G., Dorrian, G. D., Oksavik, K., Yeoman, T. K., Fogg, A. R., and Coster, A. J.: Plasma density gradients at the edge of polar ionospheric holes: the absence of phase scintillation, Ann. Geophys., 38, 575–590, https://doi.org/10.5194/angeo-38-575-2020, 2020.
On the Determination of Kappa Distribution Functions from Space Plasma Observations
by Georgios Nicolaou (Mullard Space Science Laboratory, UCL)
Solar wind plasma is often out of the classic thermal equilibrium and the particle velocities do not follow Maxwell distribution functions. Instead, numerous missions reported observations indicating that the velocities of plasma species follow kappa distribution functions which are characterized by narrow “cores” and elongated high-energy “tails”. In this study, we focus on the determination of these distributions by a novel calculation of statistical velocity and kinetic energy moments which we can potentially apply on-board to estimate the plasma parameters. We quantify this method by simulating and analyzing observations of typical solar wind protons. Moreover, we demonstrate how the instrument design affects the accuracy of the method and we suggest validation tests for future users. We highlight the importance of such a method for high time-resolution on-board analyses in space regions where the plasma is out of classic thermal equilibrium.
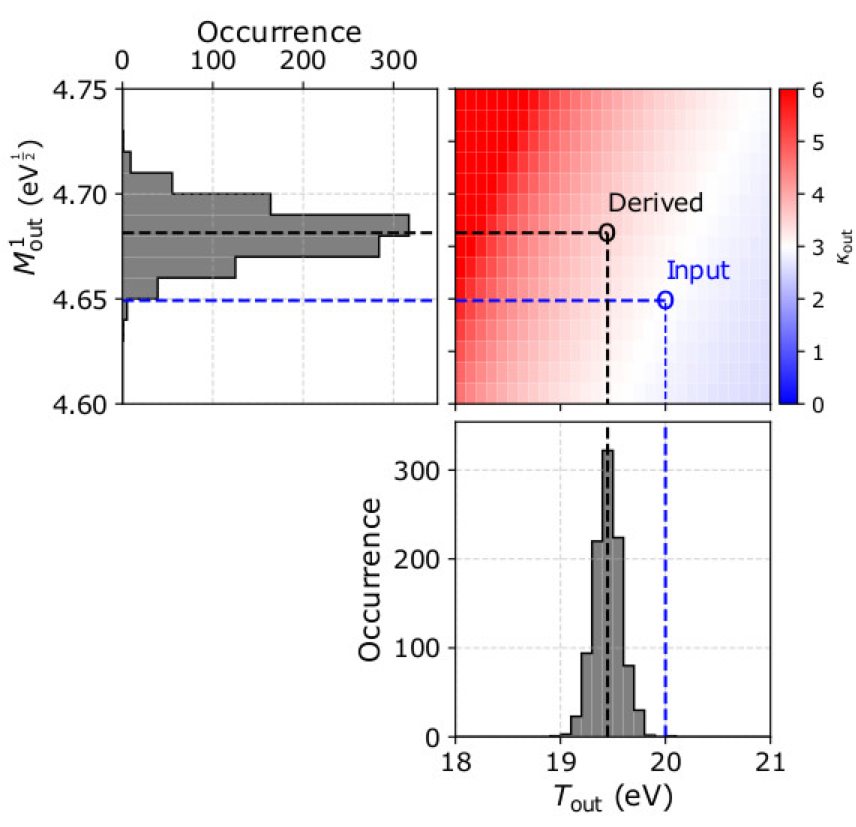
Figure 1. (Top left) The occurrence of the first order speed moment M1out and (lower right) the temperature Tout, as derived from the analysis of 1000 samples of plasma with n = 20 cm-3, u0=500 kms-1 towards Θ = 0° and Φ = 0°, T = 20 eV, and κ = 3. (Top right) Theoretical solutions of κout as a function of Tout and M1out. On each panel the blue lines indicate the input parameters and the black lines the derived parameters in our example.
Please see the paper for full details:
Nicolaou, G.; Livadiotis, G.; Wicks, R.T. On the Determination of Kappa Distribution Functions from Space Plasma Observations. Entropy 2020, 22, 212. https://doi.org/10.3390/e22020212
AE, DST and their SuperMAG Counterparts: The Effect of Improved Spatial Resolution in Geomagnetic Indices
By Aisling Bergin (University of Warwick)
Magnetometer stations on the ground are used to monitor and specify changes in the magnetosphere - ionosphere system. Geomagnetic indices based on measurements from these stations are used extensively and they have been recorded for many decades. Two examples are AE and DST , which are indices designed to measure the evolution and intensity of the auroral electrojets and the ring current, respectively. The SuperMAG collaboration have made new versions of these indices available, SME and SMR. They are based on a larger number of magnetometer stations than the original AE and DST indices.
Bergin et al. (2020) presents a statistical comparison of AE and DST geomagnetic indices with SME and SMR, their higher spatial resolution SuperMAG counterparts. As the number of magnetometer stations in the SuperMAG network increases over time, so does the spatial resolution of SME and SMR. Our statistical comparison between the established indices and their new SuperMAG counterparts finds that, for large excursions in geomagnetic activity, AE systematically underestimates SME for later cycles. The difference between distributions of recorded AE and SME values for a single solar maximum can be of the same order as changes in activity seen from one solar cycle to the next. We show that it in the case of AE and SME, it is not possible to simply translate between the two indices. We demonstrate that DST and SMR track each other but are subject to an approximate linear shift as a result of the procedure used to map stations to the magnetic equator. These results have demonstrated that important differences exist between the indices, and informs how and when these indices should be used.
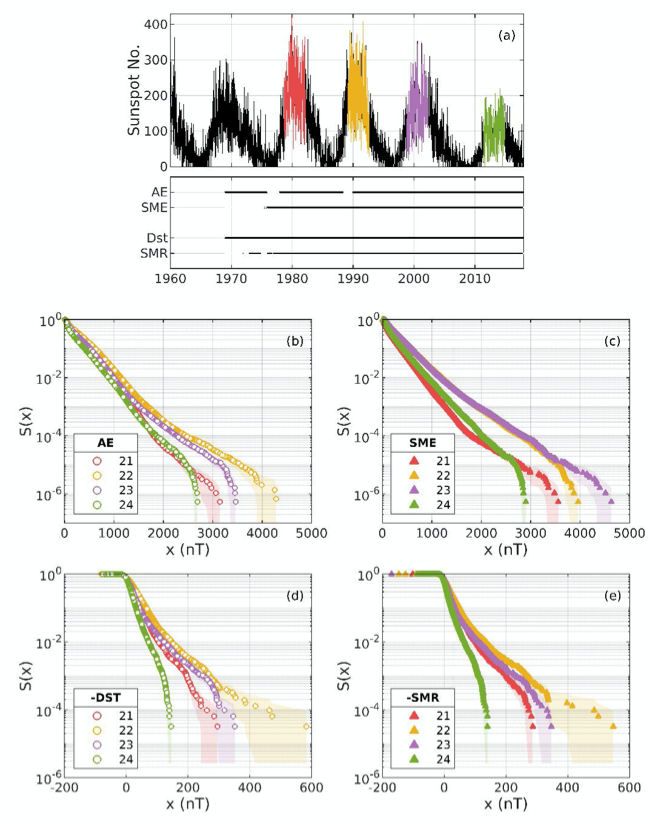
Figure 1. Survival distributions of geomagnetic indices. (a) Sunspot number for the last five solar cycles are plotted (black); coloured regions indicate periods of solar maximum from which data are used for the statistical comparison of maxima of Cycles 21 (red), 22 (yellow), 23 (purple) and 24 (green). Corresponding dates of AE, SME, DST and SMR index data availability are indicated in the black line plot below. Survival distributions based on the empirical cumulative density function of electrojet indices (b) AE and (c) SME and ring current indices (d) DST and (e) SMR are plotted for each of the four solar maxima; uncertainties are estimated using the Greenwood error formula and are indicated by shading.
Please see the paper for full details:
Bergin, A., Chapman, S. C., & Gjerloev, J. W. (2020). AE, DST and their SuperMAG Counterparts: The Effect of Improved Spatial Resolution in Geomagnetic Indices. Journal of Geophysical Research: Space Physics, 125, e2020JA027828. https://doi.org/10.1029/2020JA027828
Temporal and Spectral Studies by XMM-Newton of Jupiter’s X-ray Auroras During a Compression Event
By Affelia Wibisono (Mullard Space Science Laboratory, UCL)
Out of all of Jupiter’s aurorae, its X-ray aurora is unique as it is produced by the interactions between the constituents of Jupiter’s atmosphere with both ions and electrons. Furthermore, the X-rays are emitted by the precipitating particles rather than the native Jovian species. The X-ray aurorae are fixed on Jupiter’s frame and often exhibit quasi-periodic oscillations (QPOs) with periods of tens of minutes (e.g. Dunn et al., 2017), however, the origins of the precipitating particles and the source of the QPOs remain to be fully understood.
Contemporaneous observations by XMM-Newton and Chandra of Jupiter’s X-ray aurorae occurred for five hours in June 2017 while Juno was at near apojove. XMM-Newton continued to survey the emissions for a further 18 hours. The southern aurora was visible to XMM-Newton three times while the northern aurora was only seen twice. The planet’s magnetosphere was shown to be compressed by the solar wind during this time.
Wibisono et al., 2020 applied discrete wavelet and Fast Fourier Transforms (FFT) on the XMM-Newton auroral lightcurves from both poles. Figure 1 shows the power spectral density (PSD) plots from the FFT analysis in chronological order. QPOs were not found in the southern lights when it was first in view hence why its PSD plot is not included. The first rotation in the north had a strong pulse with a period of 27 minutes; a result that Chandra agrees with (Weigt et al., 2020). There is a secondary, less powerful beat at 23 minutes that is also observed in the south and then again in the north. This period lasts for a total duration of 12.5 hours, marking it the first time that both poles are seen to pulsate with the same period, at the same time and for more than one Jupiter rotation. The period increased to 33 minutes in the final rotation. The observed periods indicate that ultra-low frequency waves are a likely cause of the pulsations.

Figure 1: The power spectral density (PSD) plots after the Fast Fourier Transform was applied on the time intervals when regular pulsations occurred. PSDs A and C are for the entire first rotation and start of the second rotation of the northern aurora respectively. PSDs B and D are for the beginning of the second and entire third rotation of the southern aurora respectively. The dashed, dashed-dot and dotted black lines mark the 66th, 90th and 99th percentiles which were calculated by using Monte Carlo methods to produce 10 000 simulated lightcurves and determining the frequency of a periodicity of the observed power was randomly generated. The vertical red dashed lines show when the period is equal to 23 minutes. There were no regular pulsations in the first rotation in the south.
Spectral analysis of the XMM-Newton dataset gave the surprising result that during this particular magnetospheric compression event, the precipitating ions were from inside Jupiter’s magnetosphere. This outcome provides an insight into what drives Jupiter’s X-ray aurorae that have significant implications for our understanding of the wider magnetospheric dynamics at Jupiter.
For more details, see the paper:
Wibisono, A. D., Branduardi‐Raymont, G., Dunn, W. R., Coates, A. J., Weigt, D. M., Jackman, C. M., et al ( 2020). Temporal and Spectral Studies by XMM‐Newton of Jupiter's X‐ray Auroras During a Compression Event. Journal of Geophysical Research: Space Physics, 125, e2019JA027676. https://doi.org/10.1029/2019JA027676