MIST
Magnetosphere, Ionosphere and Solar-Terrestrial
Nuggets of MIST science, summarising recent papers from the UK MIST community in a bitesize format.
If you would like to submit a nugget, please fill in the following form: https://forms.gle/Pn3mL73kHLn4VEZ66 and we will arrange a slot for you in the schedule. Nuggets should be 100–300 words long and include a figure/animation. Please get in touch!
If you have any issues with the form, please contact This email address is being protected from spambots. You need JavaScript enabled to view it..
How does substorm activity affect the ring current?
by Jasmine Kaur Sandhu (MSSL, UCL)
Earth’s magnetosphere is highly dynamic and due to coupling with the solar wind huge amounts of energy can be stored in the stretched magnetotail. Substorms (impulsive bursts of nightside reconnection) rapidly close large amounts of the tail flux and, through enhanced convection and injection of plasma, substorms can significantly energise the ring current population.
Do substorms with different properties affect the ring current differently?
Substorms can occur as an isolated event (preceded and followed by quiet periods) or as part of a compound event (multiple substorms occurring one directly after the other). A statistical analysis of ion observations from the Van Allen Probes was conducted to identify the similarities and differences in the ring current population during isolated substorms and the first compound substorm in a sequence. Figure a,b,d,e shows L-MLT maps of the median ring current energy content for both isolated and compound substorms, as well as before substorm onset (growth phase) and after substorm onset (expansion phase). Figure c,f shows statistically significant changes following onset and Figure g,h shows the difference in energy content for compound substorms compared to isolated.
Both types of substorms are associated with an enhancement post-onset, where the total enhancement is larger for a compound substorm. We also observed that the ring current energy content is elevated during compound substorms compared to isolated substorms, both before and after onset. Analysis shows that a key driver of these differences is the enhanced and prolonged solar wind driving prior to onset of compound substorms. Plasma is more effectively circulated to the inner magnetosphere and the density of injections are increased.
Overall the work demonstrates the importance of solar wind driving for the substorm – ring current relationship and suggests that compound substorms are able to very effectively energise the ring current to a high degree.
For more information, please see the paper:
Sandhu, J. K., Rae, I. J., Freeman, M. P., Gkioulidou, M., Forsyth, C., Reeves, G. D., et al. (2019). Substorm‐ring current coupling: A comparison of isolated and compound substorms. Journal of Geophysical Research: Space Physics, 124. https://doi.org/10.1029/2019JA026766
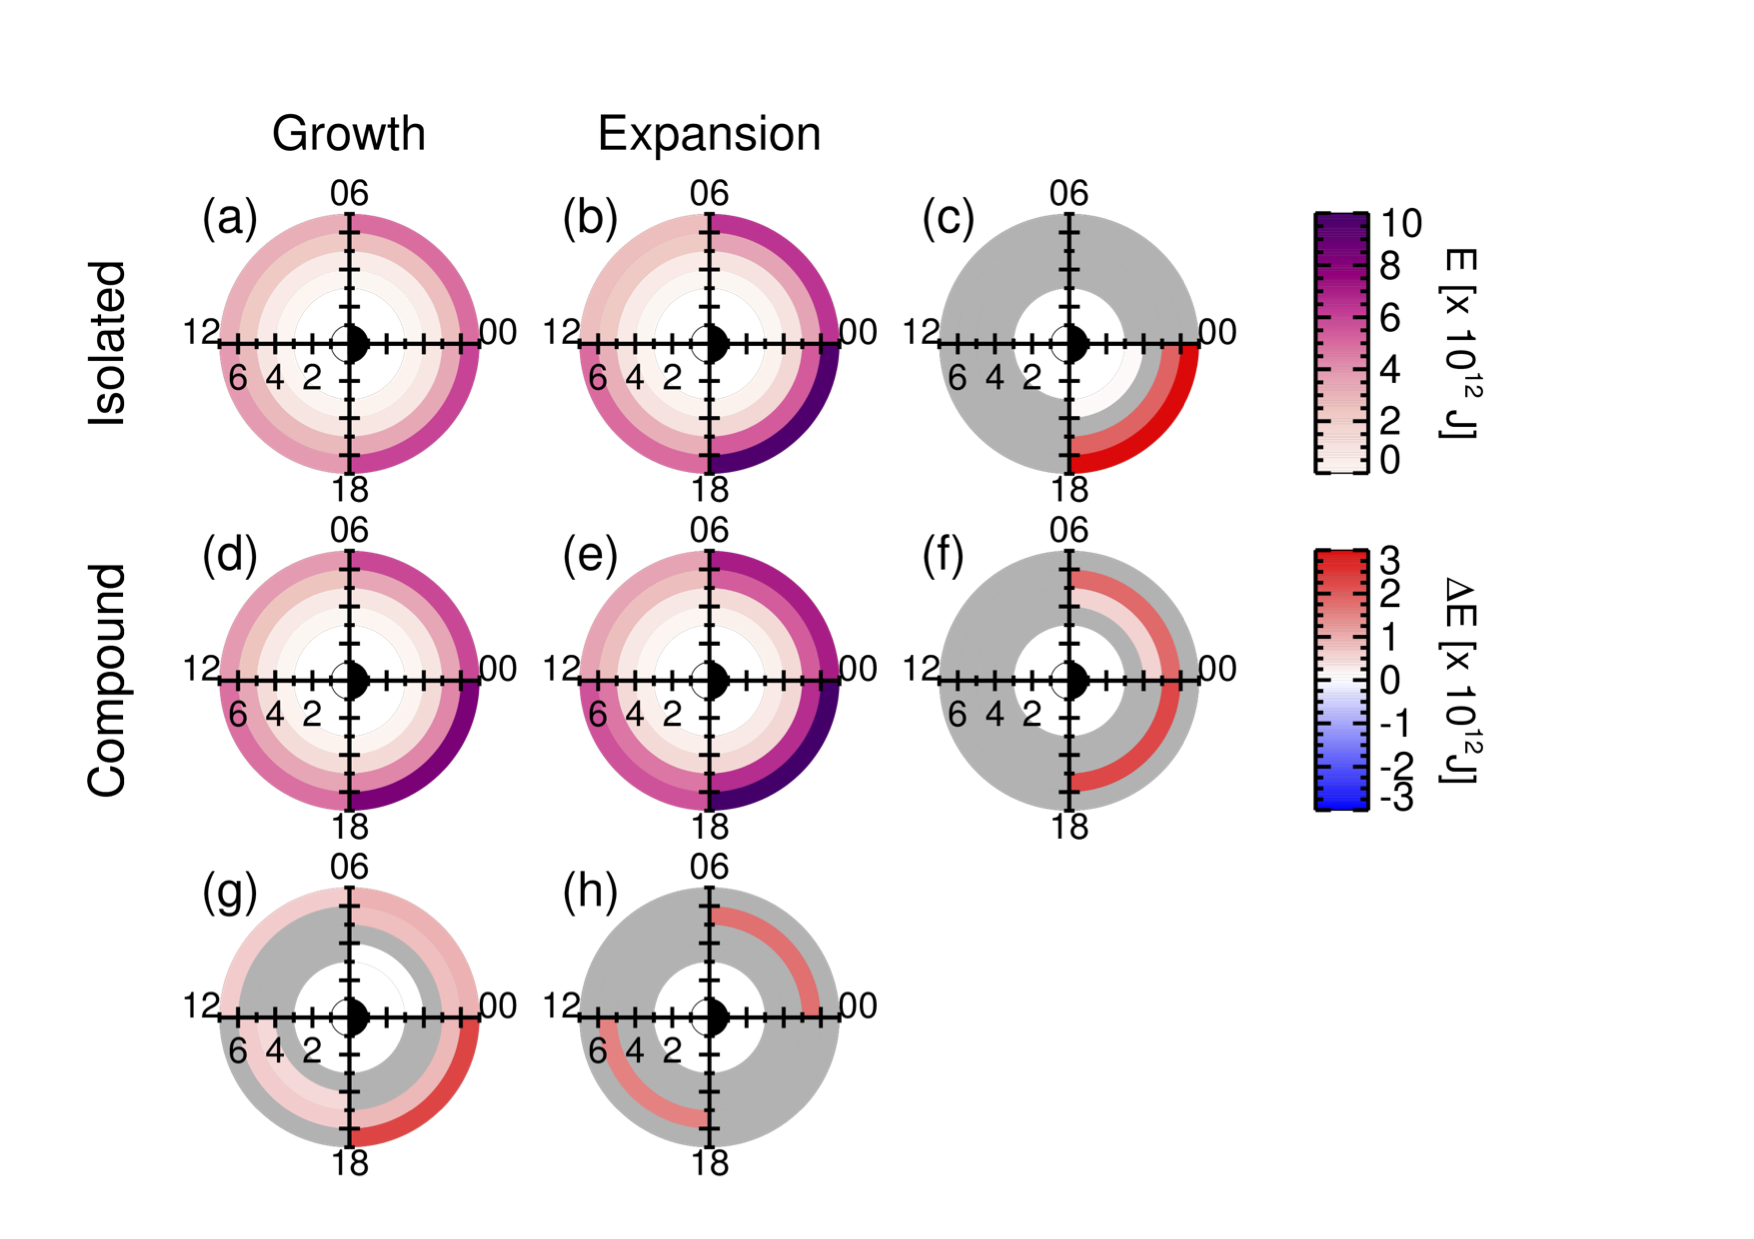
Figure: Values for each L‐MLT bin are plotted at the bins' location in the L‐MLT domain for the H+ ions. The mean energy values, E (J), are shown for (a) growth phases of isolated substorms, (b) expansion phases of isolated substorms, (d) growth phases of compound substorms, and (e) expansion phases of isolated substorms. The difference in the mean values, ΔE (J), for the expansion phase relative to the growth phase is shown for (c) isolated substorms and (f) compound substorms. The difference in mean values for the compound substorms relative to the isolated substorms is shown for (g) the growth phase and (h) the expansion phase. It is noted that, for the difference plots (c, f, g, h), the difference in mean values is only plotted if the distributions are identified to be statistically different according to the Kolmogorov‐Smirnov test with p<0.01. MLT = magnetic local time.
First evidence for multiple-harmonic standing Alfvén waves in Jupiter’s equatorial plasma sheet
By Harry Manners (Imperial College London)
Ultra-low-frequency (ULF) magnetohydrodynamic waves carry energy and momentum through planetary magnetospheres, corresponding to perturbations on large spatial-scales. These perturbations can lead to global oscillations of the magnetic field known as field line resonances (FLRs). While ULF waves and FLRs have been studied extensively in the terrestrial magnetosphere, relatively little literature exists concerning the same phenomena in magnetospheres of the outer planets.
We have used magnetometer data from the Galileo spacecraft to search for ULF wave-power at Jupiter, specifically in the thin, dense equatorial plasma sheet (see panel a of Figure). By removing the background magnetic field we were able to isolate perturbations in the direction transverse to the background field (panel b). We obtained frequency-time information via wavelet transforms of the magnetic-field residuals.
We found evidence for a multiple-harmonic wave structure isolated in the equatorial plasma sheet, on 8th November 1996. Four harmonics were detected, with periods ranging from 4 to 22 minutes (panel c).
We band-pass filtered the transverse field components to obtain a ~1 nT contribution from each harmonic. Subsequent polarization analysis revealed reversals in handedness in each signal consistent with the structure of a multiple-harmonic standing Alfvén wave (panel d). The same analysis suggests all of the detected harmonics are odd modes, with no evidence to support the presence of even modes. We currently have no explanation for the absence of the even modes, but speculate that it is a consequence of the symmetry of the driving mechanism with respect to the magnetic equator.
For more information, please see the paper:
Manners, H. A., & Masters, A. (2019). First evidence for multiple‐harmonic standing Alfvén waves in Jupiter's equatorial plasma sheet. Geophysical Research Letters, 46. https://doi.org/10.1029/2019GL083899
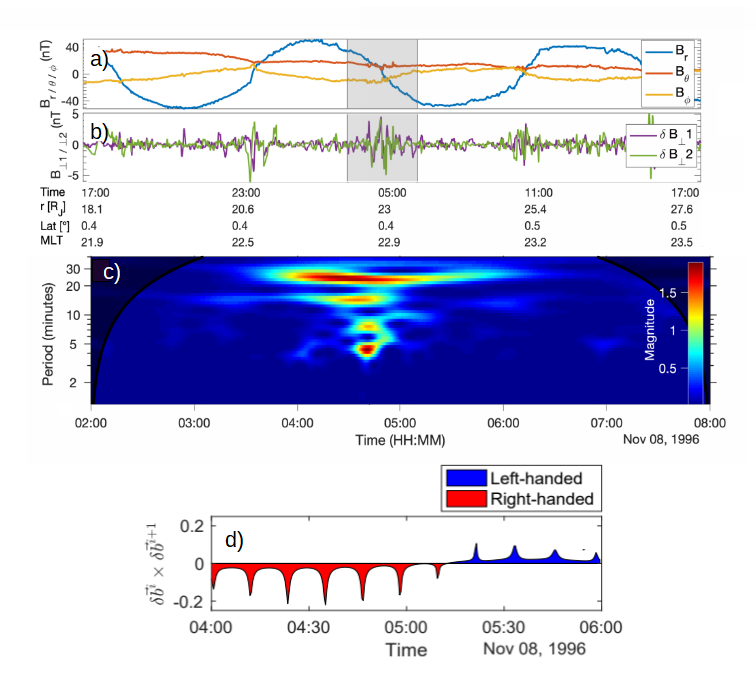
Figure: a) Magnetic field data from the Galileo spacecraft during 8th November 1996. b) Transverse magnetic field residuals, showing ULF wave packets. c) Wavelet transform of one of the transverse components, showing coincident enhancements in wave power at 22, 14, 7 and 4 minutes. d) Reversals in the handedness of the 22 minute wave signal, consistent with standing Alfvén waves.
Timescales of Birkeland Currents Driven by the IMF
By John Coxon (University of Southampton)
Birkeland currents are the mechanism by which information is communicated from Earth’s magnetopause to the ionosphere. Understanding the timescales of these currents is very useful for understanding the ionosphere’s reaction to magnetopause phenomena. We use the Active Magnetosphere and Planetary Electrodynamics Response Experiment (AMPERE) dataset, which uses magnetometers on 66 spacecraft in low Earth orbit to derive Birkeland current density on a grid of colatitude and magnetic local time. The current densities are derived in a ten minute sliding window, evaluated every two minutes.
We use the SPatial Information from Distributed Exogenous Regression (SPIDER) technique (Shore et al, 2019), which treats each coordinate of a global dataset (e.g. AMPERE or SuperMAG) independently, regressing the time series in each coordinate against some external driver to find the time lag that maximises the correlation of the two.
The figure below shows the correlation (left) and lag (centre) of the current densities with Interplanetary Magnetic Field (IMF) Bz. We focus on the R1 and R2 regions (right) here. Southward (negative) Bz drives Birkeland current as a result of magnetic reconnection, as shown by the correlations. Looking at the lags on the dayside, the poleward lags are 10–20 minutes, reflecting the time taken for the Birkeland currents to start to react to magnetic reconnection. At all MLT, the equatorward lags are 60–90 minutes, reflecting the time at which the polar cap is largest. On the nightside, the poleward lags are 90–150 minutes, reflecting how long it takes the polar cap to contract during nightside reconnection. More details on the R1/R2 correlations, and other correlations between Birkeland current and IMF Bz and By, are available in the full study.
For more information, please see the paper:
, , , , , , et al. ( 2019). Timescales of Birkeland currents driven by the IMF. Geophysical Research Letters, 46, 7893– 7901. https://doi.org/10.1029/2018GL081658

Figure: Correlation (left) and lag (centre) of AMPERE current density with IMF Bz in March 2010. A key to the regions visible is presented in the right-hand panel, to allow easy references in the text above.
The Impact of Radiation Belt Enhancements on Electric Orbit Raising
By Alexander Lozinski (British Antarctic Survey)
Electric orbit raising is a method of getting satellites into geostationary orbit (GEO) using low-thrust electric propulsion. A satellite intended for GEO is first placed into elliptical geostationary transfer orbit after separating from the launch vehicle. Following this, maneuvers are performed to raise the satellite to GEO. In conventional launches, chemical propulsion is used and this process requires a few days. With electrical thrusters, orbit raising can be performed more efficiently but requires a longer period (around 200 days) due to the lower thrust.
This method of raising satellites was introduced commercially in 2014 with the launch of the first all-electric satellites. Although the lower wet mass due to lack of chemical propellant reduces launch costs, the longer time required for the satellite to reach GEO leaves it exposed to irradiation from trapped protons of the Van Allen belts. This can cause degradation to solar cells via non-ionising displacement collisions.
Sustained enhancements in trapped proton flux can occur via trapping of solar energetic particles following a large geomagnetic disturbance. In this work, the solar cell degradation through time for a variety of real electric orbit raising scenarios was calculated in both a quiet and active environment, based on measurements taken by CRRES before/after the March 1991 storm. The trajectories of two previously launched satellites (EOR-1 and EOR-2) that underwent electric orbit raising is shown in the figure. The figure also shows the calculated remaining output power of the solar cell, P/P0, through time for both trajectories in an active environment. Reductions in P/P0 represent degradation to the solar cells.
A key finding is a large (up to 5%) increase in P/P0 degradation that occurs when electric orbit raising is performed in an enhanced radiation belt environment. However, the figure also demonstrates that some orbits are more at risk than others. Orbits with a higher initial apogee (e.g. EOR-2, red line) spend less time in regions of high proton flux, and experience less degradation. The work highlights the significant impacts of an enhanced environment on solar cell degradation, and identifies how this degradation can in part be mitigated with an appropriate choice of orbit and shielding.
For more information, please see the paper:
Lozinski, A. R., Horne, R. B., Glauert, S. A., Del Zanna, G., Heynderickx, D., & Evans, H. D. R. ( 2019). Solar cell degradation due to proton belt enhancements during electric orbit raising to GEO. Space Weather, 17. https://doi.org/10.1029/2019SW002213
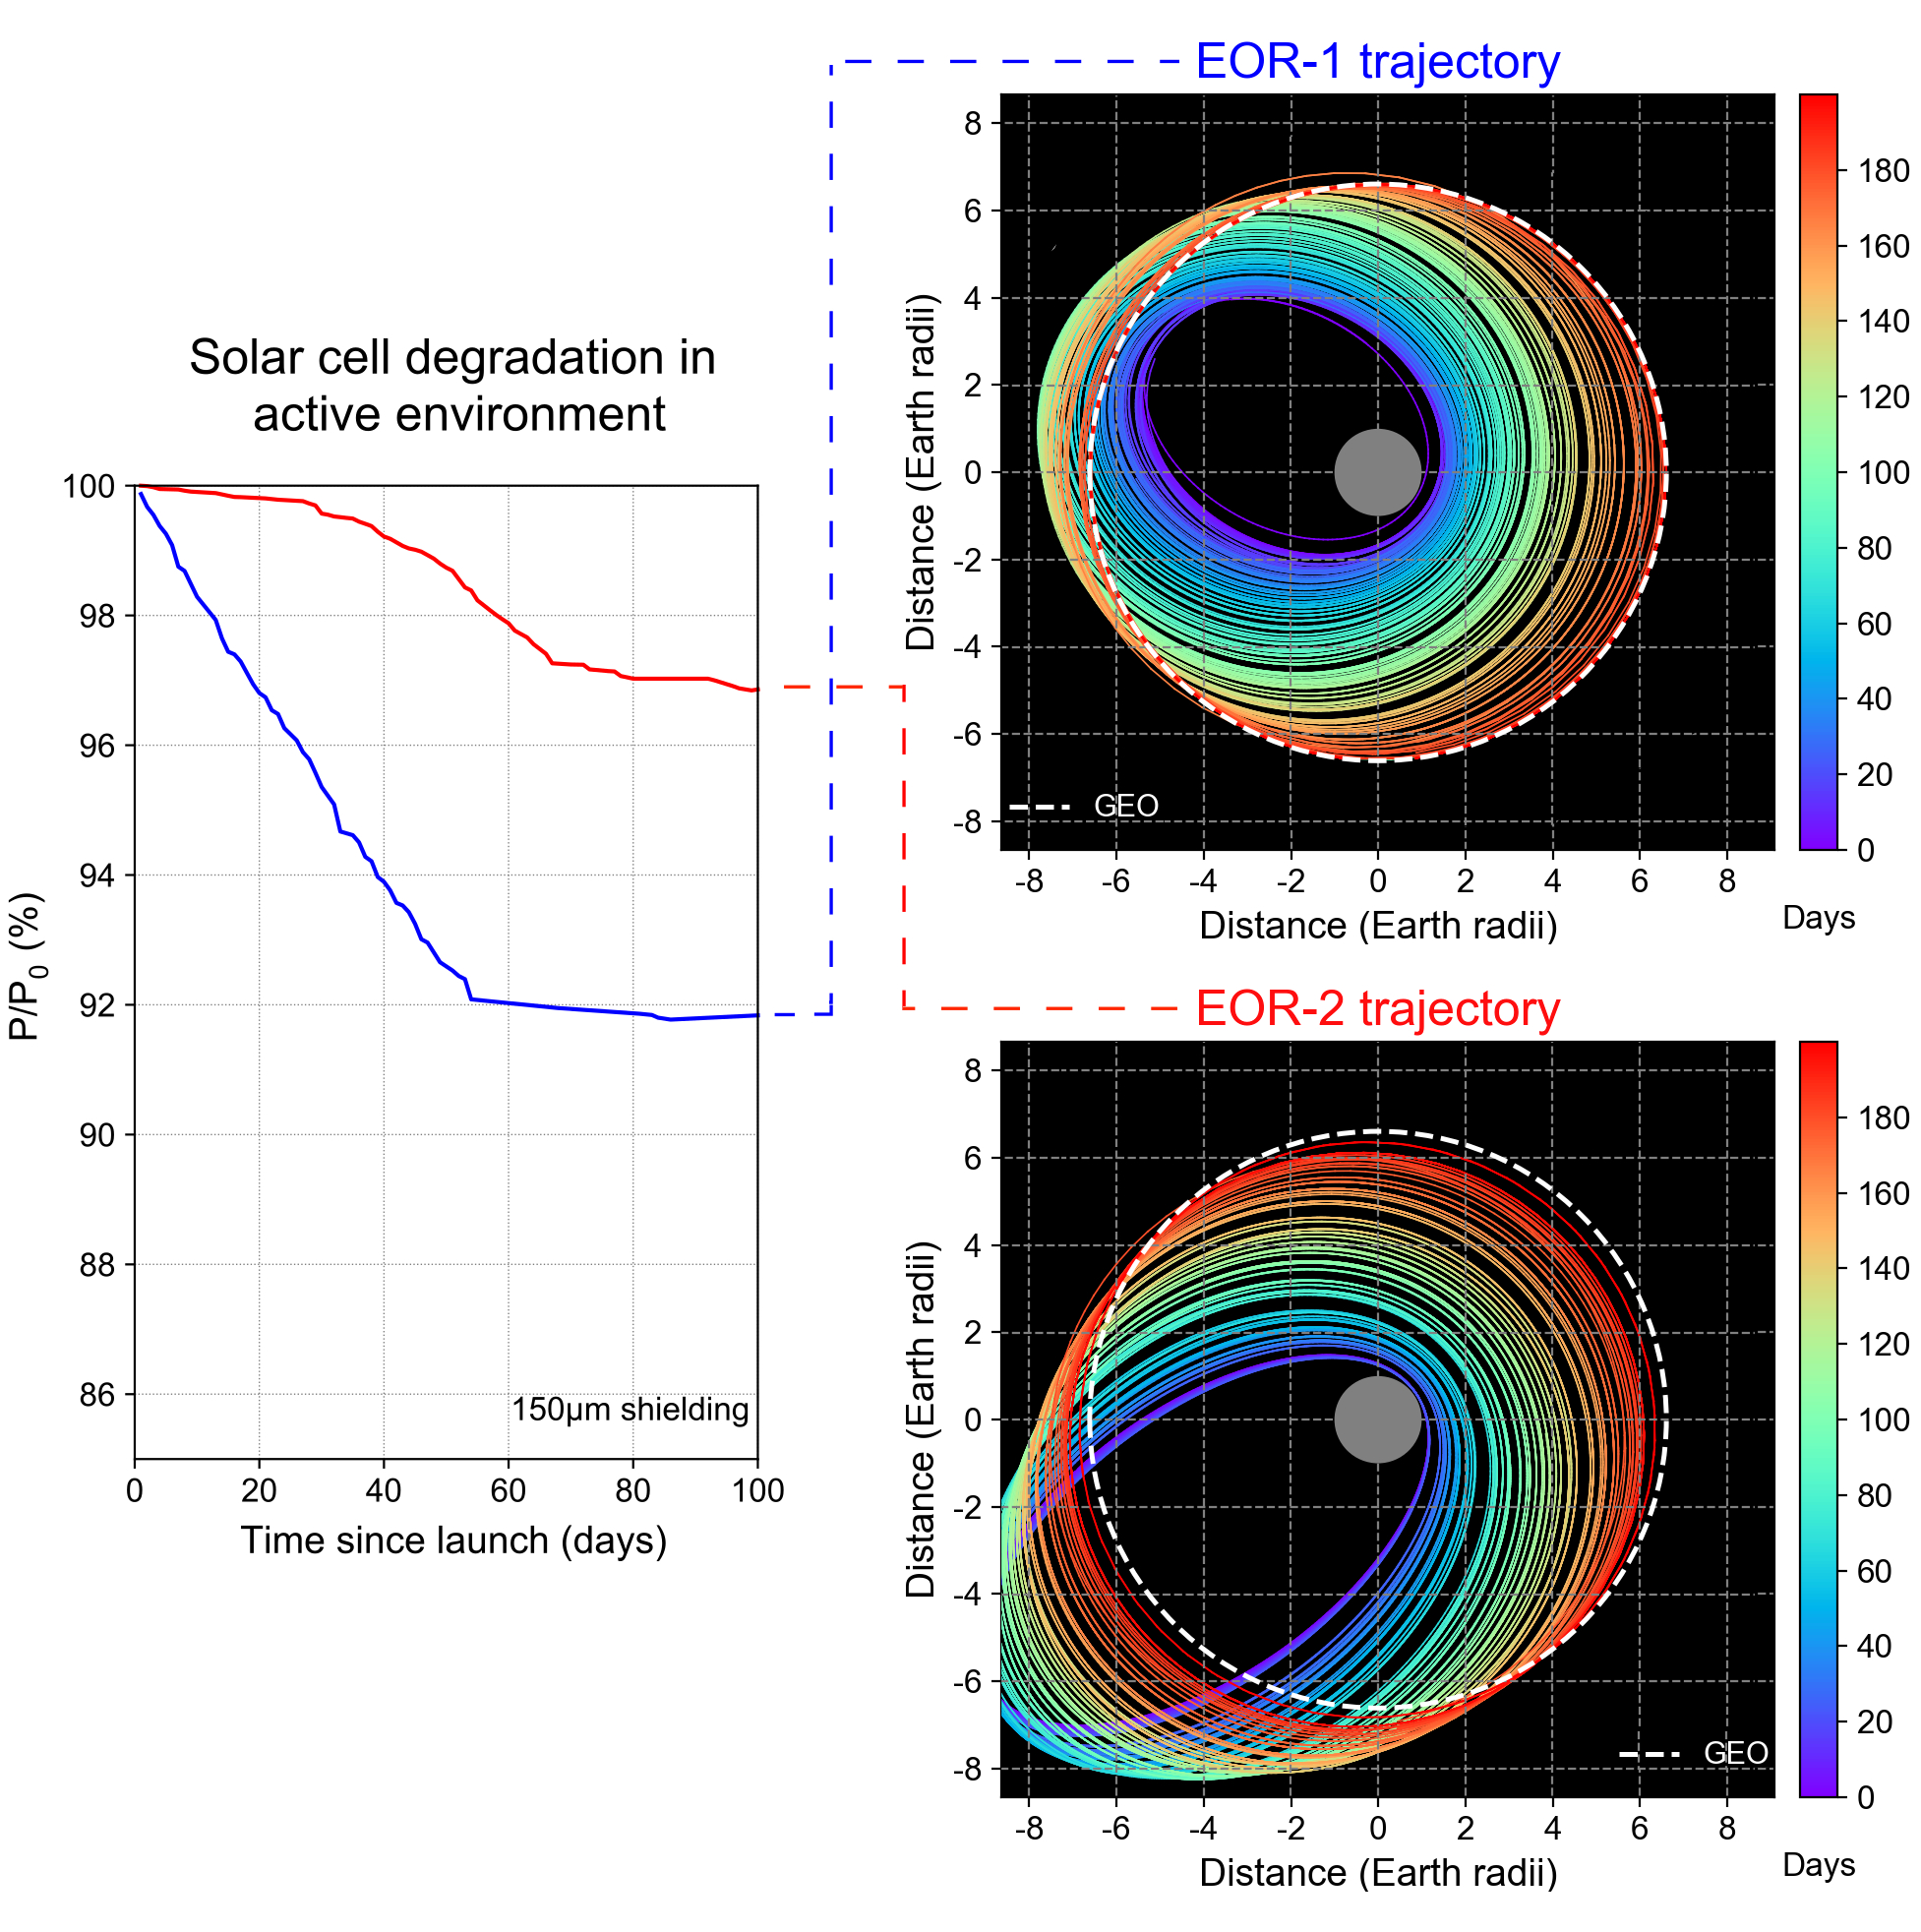
Figure caption: The left panel shows the remaining power, P/P0, as a function of time for two satellites. The right panels show trajectories of the two satellites over the first 200 mission days.
SuperDARN Observations During Geomagnetic Storms, Geomagnetically Active Times, and Enhanced Solar Wind Driving
by Maria-Theresia Walach (Lancaster University)
At Earth, solar wind coupling drives large scale convection of field lines: antisunward flow of open field lines at high latitudes and the return flow of closed field lines at lower latitudes. This convection can be observed through measurements of the ionosphere, for example using measurements from SuperDARN, an international network of ground based radars, purposely built to study ionospheric convection. We use 7 years of Super Dual Auroral Radar (SuperDARN) data to study ionospheric convection during geomagnetic storms, geomagnetically active times and solar wind driven times. Using the most recent years of SuperDARN data allows us to study ionospheric convection at the mid-latitudes with a field-of-view spanning from the pole to 40 degrees of magnetic latitude.
In this study, we address a number of questions; for example, do we make similar SuperDARN observations during similar solar wind driving during nonstorm time as during storm time? Do SuperDARN observations change throughout the different phases of a storm? Where do we see the fastest flows with SuperDARN, and is it linked to the extent of latitudinal coverage from the radars? Does the latitudinal range of the convection, given, for example, by the return flow region, stay constant throughout a storm? We find that initial and recovery phases of geomagnetic storms show similar convection as enhanced solar wind driving when no geomagnetic storm occurs.
One of the key findings showing the change of regime between the initial, main, and recovery phase of the storm is shown in the figure: it shows the varying relationship between the flow reversal boundary (here FRB but otherwise known as the open-closed field line boundary or polar cap boundary) and the Heppner-Maynard boundary (here HMB, which corresponds to the lower latitude boundary where the ionospheric convection electric field approaches 0 kV). The blue line shows the line of best fit and the data distribution along it, indicates that the boundaries must expand and contract together, however, this happens at different rates during the different storm phases, producing an inflated return flow region during the main phase of the storm.
For more information, please see the paper below:
, & ( 2019). SuperDARN observations during geomagnetic storms, geomagnetically active times, and enhanced solar wind driving. Journal of Geophysical Research: Space Physics, 124. https://doi.org/10.1029/2019JA026816
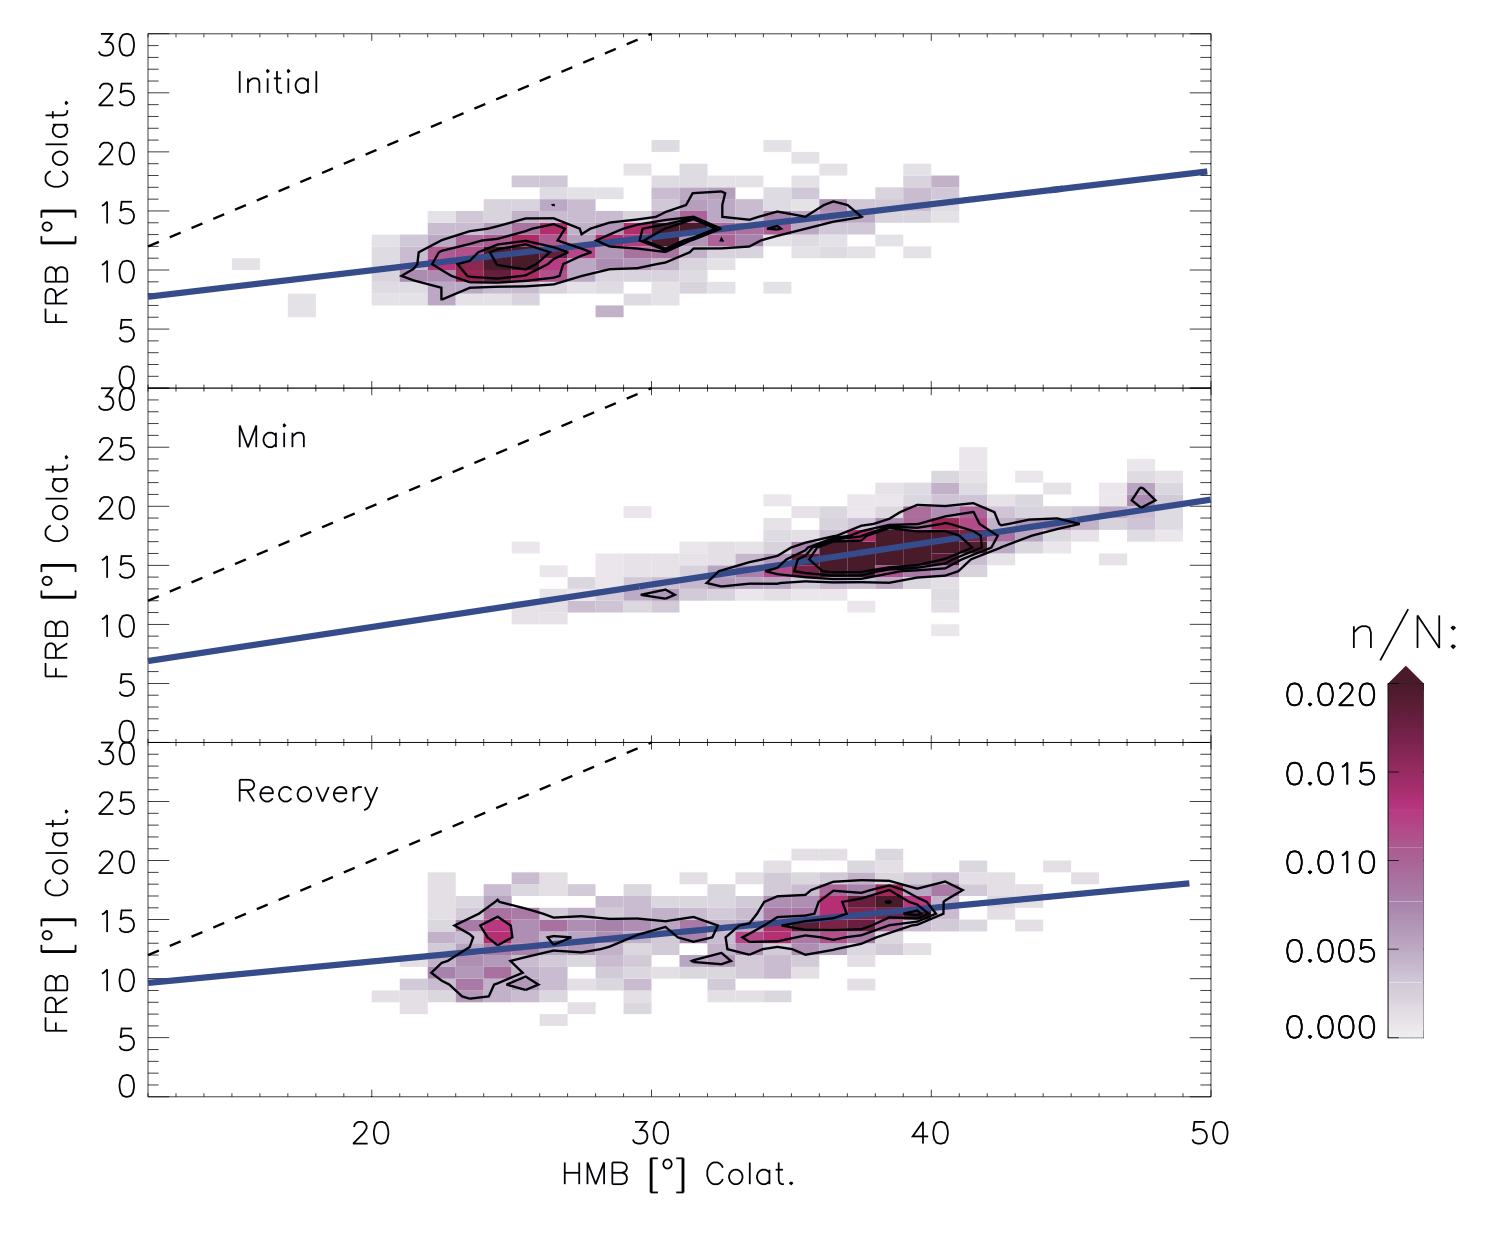
Figure: Colatitude location of the flow reversal boundary (FRB) against the Heppner‐Maynard boundary (HMB) during the three phases of geomagnetic storms (only using maps where n ≥ 200). The dashed black lines show the line of unity and the black contours correspond to where the normalized data point density corresponds to 0.005, 0.01, 0.015, and 0.02.
