MIST
Magnetosphere, Ionosphere and Solar-Terrestrial
Nuggets of MIST science, summarising recent papers from the UK MIST community in a bitesize format.
If you would like to submit a nugget, please fill in the following form: https://forms.gle/Pn3mL73kHLn4VEZ66 and we will arrange a slot for you in the schedule. Nuggets should be 100–300 words long and include a figure/animation. Please get in touch!
If you have any issues with the form, please contact This email address is being protected from spambots. You need JavaScript enabled to view it..
Exploring Key Characteristics in Saturn’s Infrared Auroral Emissions Using VLT-CRIRES: H3+ Intensities, Ion Line-of-Sight Velocities, and Rotational Temperatures
by Nahid Chowdhury (University of Leicester)
Saturn’s aurorae are generated by interactions between high-energy charged particles and neutral atoms in the upper atmosphere. Infrared observations of auroral emissions make use of H3+ – a dominant hydrogen ion in Saturn’s ionosphere – that acts as a tracer of energy injected into the ionosphere.
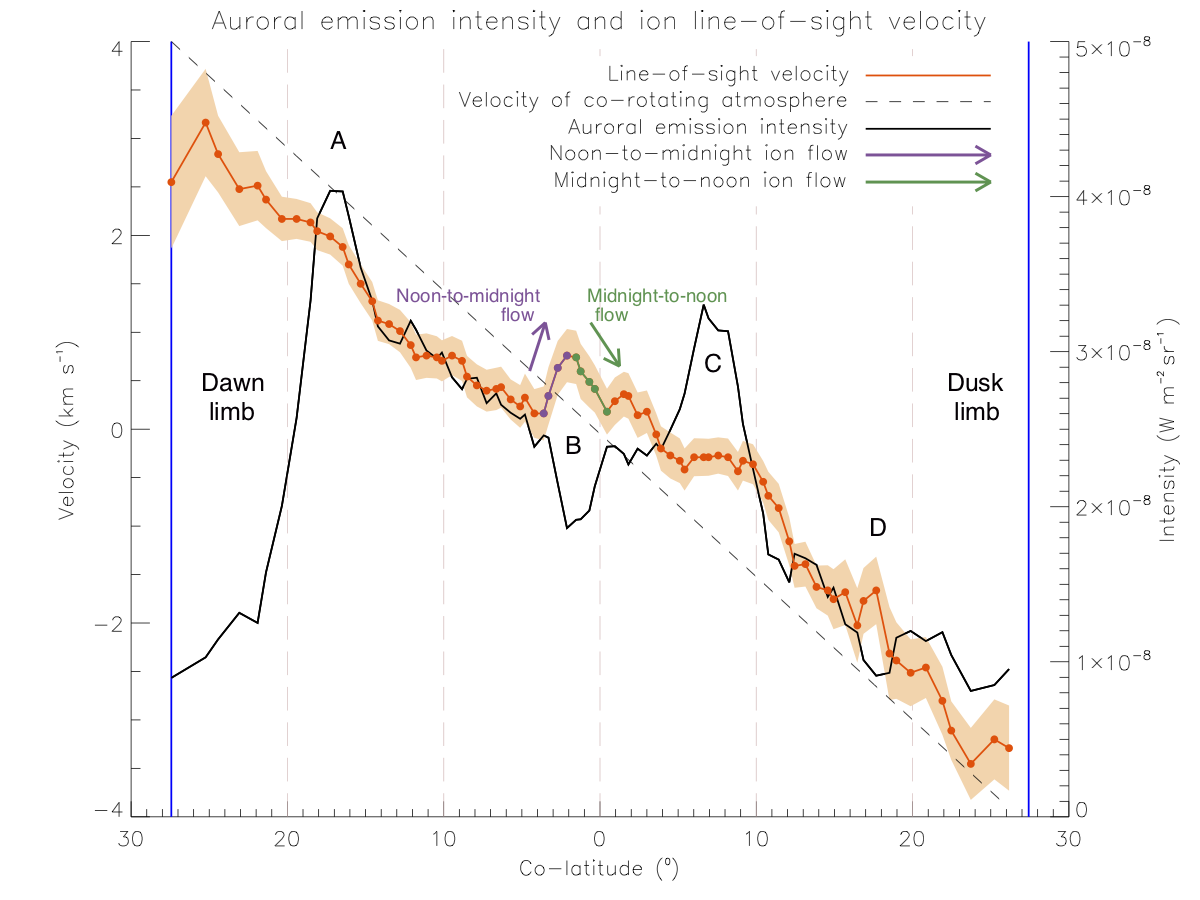
We analysed observations taken in May 2013 of Saturn’s northern infrared auroral emissions with the Very Large Telescope in Chile using the CRIRES instrument. The use of adaptive optics, combined with the high spectral resolution of VLT-CRIRES (100,000), meant that this dataset offered an unprecedented spatially and spectrally resolved ground-based view of Saturn's infrared aurora. Using discrete H3+ emission lines, we derived dawn-to-dusk auroral emission intensity, ion line-of-sight velocity, and thermospheric temperature profiles, allowing us to probe the physical properties of Saturn’s polar atmosphere.
Our analysis showed an enhancement in the dawn-side auroral emission intensity, a common feature that is known to be linked with solar-wind compressions in the kronian magnetosphere, and the presence of a localised dark region in the aurora very close to the pole. The ion line-of-sight velocity profile revealed previously unknown smaller-scale structures in the ion flows. In particular, the ion flows near the centre of the pole (at position B in Figure 1) could be consistent with the behaviour of a relatively small ionospheric polar vortex whereby the ions are interrupting the general dawn-to-dusk trend in movement to instead adopt a very sharp shearing motion of ions first toward midnight and then almost immediately back toward noon. Our thermospheric temperature derivations also reveal a very subtle temperature gradient that increases from 350 K on the dawn-side of the pole to 389 K on the dusk-side.
This work has bought to light complex features in the behaviour of H3+ ions in Saturn’s upper atmosphere for the first time and highlights the need for additional analyses of two-dimensional scanned maps of Saturn’s auroral regions with a view to addressing some of the major outstanding questions surrounding Saturn’s thermosphere-ionosphere-magnetosphere interaction.
For more information, please see the paper below:
, , , & ( 2019). Exploring key characteristics in Saturn's infrared auroral emissions using VLT‐CRIRES: H3+intensities, ion line‐of‐sight velocities, and rotational temperatures. Geophysical Research Letters, 46. https://doi.org/10.1029/2019GL083250.

Figure 1: The ion line-of-sight velocity and auroral emission intensity profiles are plotted as a function of co-latitude on the planet. Evidence for ion flows possibly consistent with the behaviour of an intriguing ionospheric polar vortex is adjacent to the area marked by the letter B, between approximately 0⁰ and 5⁰ co-latitude on the dawn-side of Saturn’s northern pole.
Directed network of substorms using SuperMAG ground-based magnetometer data
by Lauren Orr (University of Warwick)
Space weather can cause large-scale currents in the ionosphere which generate disturbances of magnetic fields on the ground. These are observed by >100 magnetometer stations on the ground. Network analysis can extract the important information from these many observations and present it as a few key parameters that indicate how severe the ground impact will be. We quantify the spatio-temporal evolution of the substorm ionospheric current system utilizing the SuperMAG 100+ magnetometers, constructing dynamical directed networks from this data for the first time.
Networks are a common analysis tool in societal data, where people are linked based on various social relationships. Other examples of networks include the world wide web, where websites are connected via hyperlinks, or maps where places are linked via roads. We have constructed networks from the magnetometer observations of substorms, where magnetometers are linked if there is significant correlation between the observations. If the canonical cross-correlation (CCC) between vector magnetic field perturbations observed at two magnetometer stations exceeds a threshold, they form a network connection. The time lag at which CCC is maximal, |τC|, determines the direction of propagation or expansion of the structure captured by the network connection. If spatial correlation reflects ionospheric current patterns, network properties can test different models for the evolving substorm current system.
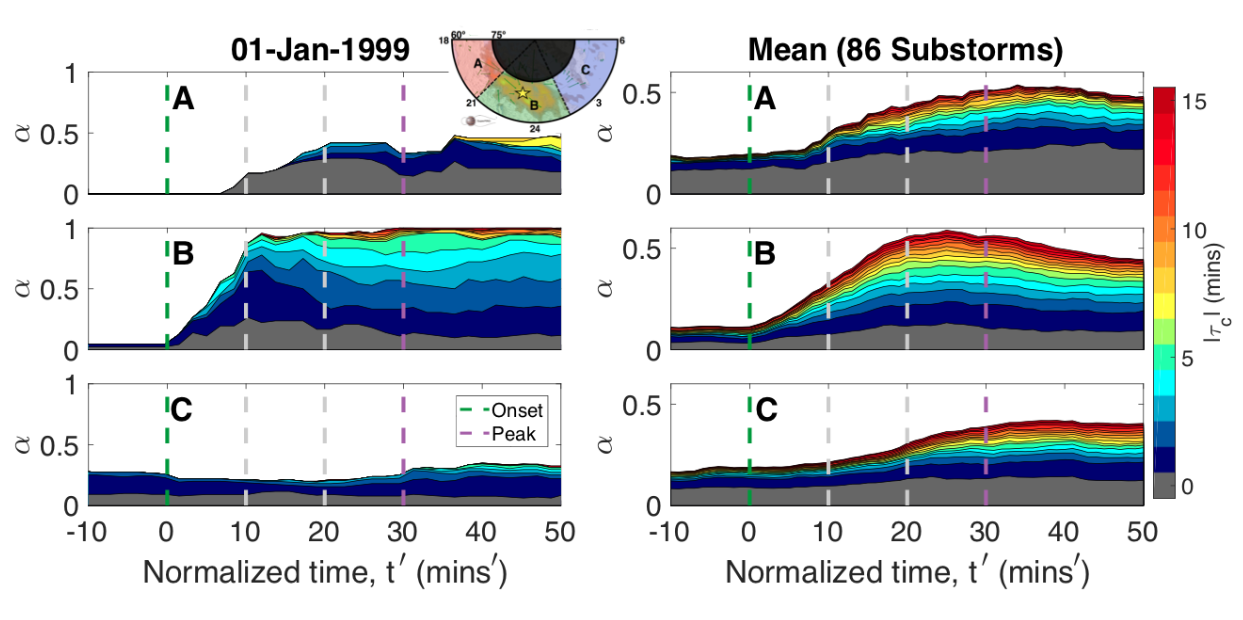
In this study, we select 86 isolated substorms based on nightside ground station coverage. The results are shown for both a single event and for all substorms in the figure. We find, and obtain the timings for, a consistent picture in which the classic substorm current wedge (SCW) forms, quantifying both formation and expansion. A current system is seen pre-midnight following the SCW westward expansion. Later, there is a weaker signal of eastward expansion. Finally, there is evidence of substorm-enhanced magnetospheric convection. These results demonstrate the capabilities of network analysis to understand magnetospheric dynamics and provide new insight into how the SCW develops and evolves during substorms.
For more information please see the paper below:
Orr, L., Chapman, S. C., and Gjerloev, J. W.. ( 2019), Directed network of substorms using SuperMAG ground‐based magnetometer data. Geophys. Res. Lett., 46. https://doi.org/10.1029/2019GL082824

Figure: The normalized number of connections, α(t',τC), is binned by the lag of maximal canonical cross-correlation, |τC|. Each panel stacks, one above the other, α(t',τC) versus normalized time, t’, for |τC|≤15. The regions are indicated on the polar plot and the regions were determined using Polar VIS images of the auroral bulge at the time of maximum expansion. Region B (around onset) exhibits a rapid increase in correlation following substorm onset.
Long-term variations in solar wind parameters, magnetopause location, and geomagnetic activity over the last five solar cycles
by Andrey Samsonov (Mullard Space Science Laboratory, UCL)
The magnetopause is a natural boundary between the solar wind and magnetospheric plasmas. Geosynchronous orbit, where numerous communications, meteorological and GPS satellites operate, is usually located in the magnetosphere but occasionally due to variable solar wind conditions the magnetosphere may significantly compress and those satellites will cross the magnetopause and get in direct contact with the solar wind plasma. Fast streams of dense solar wind plasma as well as solar energetic particles might damage the satellites. Therefore the study of variations of the magnetopause standoff distance is an important problem of space physics. The magnetopause location can be described by empirical models (e.g. Shue et al., 1998; Lin et al., 2010).
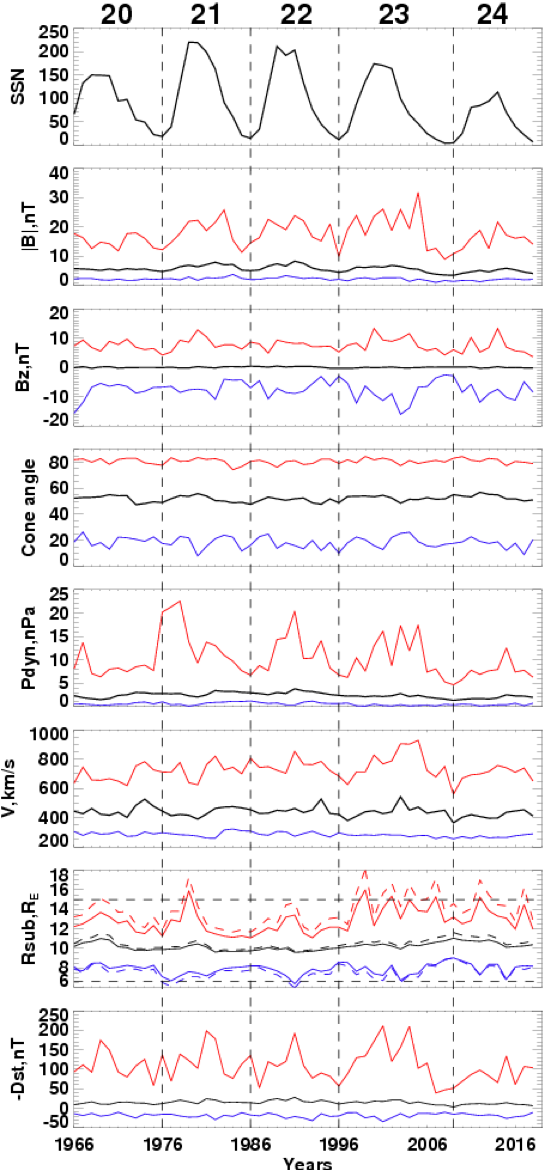
In our recent work, we studied long term changes in the magnetopause position. We use both OMNI solar wind observations and empirical magnetopause models to reconstruct time series of the magnetopause standoff distance for nearly five solar cycles (from 1966 to 2018). The magnetopause standoff distance on this time scale depends mostly on the solar wind dynamic pressure (Pdyn). The 11-year solar cycles in the Pdyn variations are superimposed by an increasing trend before 1991 and a decreasing trend between 1991 and 2009. Correspondingly, we find that the standoff distance predicted by magnetopause models increases by nearly 2 RE from 1991 to 2009. The annual sunspot number (SSN), IMF magnitude and magnetospheric geomagnetic activity indices display the same trends as the dynamic pressure. We calculate extreme solar wind parameters and magnetopause standoff distance in each year using daily values and find that both extremely small and large standoff distances during a solar cycle preferably occur at solar maximum rather than at solar minimum (see figure below).
Furthermore, we calculated correlations between annual average solar wind and magnetospheric parameters, and the SSN. The annual IMF magnitude well correlates with SSN with a zero time lag, while the annual Pdyn correlates reasonably well with the SSN but with 3-years time lag. Both the annual solar wind density and velocity well correlate with the dynamic pressure, but the correlation coefficient is higher for density than for velocity. The annual Kp index better correlates with Pdyn, while Dst index better correlates with Bs (negative IMF Bz). This correlation analysis helps to better understand relations between solar, solar wind and magnetospheric parameters on the long time scale.
The knowledge of predicted magnetopause position for the next solar cycle is important for future space missions, especially for those which are intended to observe the dayside magnetopause whether in situ or remotely. One of the forthcoming missions which will study variations of the dayside magnetopause is the Solar Wind Magnetosphere Ionosphere Link Explorer (SMILE).
For more information, please see the paper below:
Samsonov, A. A., Bogdanova, Y. V., Branduardi‐Raymont, G., Safrankova, J., Nemecek, Z., & Park, J.‐S. ( 2019). Long‐term variations in solar wind parameters, magnetopause location, and geomagnetic activity over the last five solar cycles. Journal of Geophysical Research: Space Physics, 124. https://doi.org/10.1029/2018JA026355

Figure: The sunspot numbers, average and extreme IMF magnitude and Bz, IMF cone angle (the angle between IMF vector and xaxis), solar wind dynamic pressure and velocity, magnetopause standoff distance (solid lines for Shue et al.'s model and dashed lines for Lin et al.'s model), and geomagnetic Dst index. Annual average values shown by black, daily maximal and minimal values for each year shown by red and blue. Vertical lines separate solar cycles as indicated by numbers at the top.
Origin of the extended Mars radar blackout of September 2017
By Beatriz Sánchez-Cano (University of Leicester)
Several instrument operations, as well as communication systems with rovers at the surface, depend on radio signals that propagate throughout the atmosphere of Mars. This is the case for two radars currently operational in Mars’ orbit, sounding the ionosphere, surface and subsurface of the planet: The Mars Advanced Radar for Subsurface and Ionosphere Sounding (MARSIS) on board Mars Express, which operates between 0.1 and 5.5 MHz, and the Shallow Radar (SHARAD) onboard the Mars Reconnaissance Orbiter, which operates at 20 MHz. However, both radars typically suffer from complete blackouts for several days (and even weeks) when solar storms hit Mars. It is thought that an increase in the electron density of the lower ionosphere below 100 km occurs, where even a small enhancement in ionization significantly increases the signal attenuation. In analogy with Earth, some works suggest that solar protons of tens of MeV can cause these absorption layers. However, at Mars, the current origin andlong duration is not known.
Sánchez-Cano et al. (2019) focused on both the MARSIS and SHARAD radar performances during a powerful solar storm that hit Mars in September 2017. The space weather event consisted of a X8.2-class flare emitted by the Active Region 12673 at the western limb of the solar disk on 10 September 2017 (Figure 1a). This was followed by solar energetic particles (ions and electrons) that arrived at Mars few hours later, as recorded by the Mars Atmosphere and Volatile EvolutioN (MAVEN) mission (see Figure 1b,c). Based on MAVEN observations and numerical simulations of energetic electron precipitation, Sánchez-Cano et al. (2019) found that high energy electrons (and not protons) were the main ionization source, creating a dense layer of ions and electrons of magnitude ~1010 m-3 at ~90 km on the Martian nightside. For frequencies between 3 and 20 MHz, the peak absorption level is found at 70 km altitude, and the layer was composed mainly of O2+, the main Martian ionosphere component. This layer attenuated radar signals continuously for 10 days, preventing the radars from receiving any HF signals from the planetary surface across a planetary scale (Figure 1d). This contrasts with the typical few hour durations that these phenomena have at Earth.
This work highlights the need for careful assessments of radar performances for future operational systems, especially during space weather events. During these events, a good characterization of the low ionosphere is necessary for radar operations (and other instruments that use HF radio links), operational planning, as well as for communications with the Martian surface in the HF range.
For more information please see the paper below:
Sánchez‐Cano, B., Blelly, P.‐L., Lester, M., Witasse, O., Cartacci, M., Orosei, R., et al ( 2019). Origin of the extended Mars radar blackout of September 2017. Journal of Geophysical Research: Space Physics, 124. https://doi.org/10.1029/2018JA026403
Figure 1: (a) MAVEN-EUV irradiance observations of wavelength 0.1-7 nm. (b) MAVEN-SEP ion differential flux spectra. (c) MAVEN-SEP electron differential flux spectra. (d) Each symbol denotes when MARSIS and SHARAD were in operation. Empty symbols designate the cases when the surface was observed, and filled symbols when was not observed. The exception are green diamonds that indicate the times when SHARAD observed a highly blurry surface.
Equatorial magnetosonic waves observed by Cluster satellites: The Chirikov resonance overlap criterion
by Homayon Aryan (University of Sheffield)
Numerical codes modelling the evolution of the radiation belts often account for wave-particle interaction with magnetosonic waves. The diffusion coefficients incorporated in these codes are generally estimated based on the results of statistical surveys of the occurrence and amplitude of these waves. These statistical models assume that the spectrum of the magnetosonic waves can be considered as continuous in frequency space, however, this assumption can only be valid if the discrete nature of the waves satisfy the Chirikov resonance overlap criterion.
The Chirikov resonance overlap criteria describes how a particle trajectory can move between two resonances in a chaotic and unpredictable manner when the resonances overlap, such that it is not associated with one particular resonance [Chirikov, 1960]. It can be shown that the Chirikov resonance overlap criterion is fulfilled if the following equation is satisfied:
δθ = (vl / tanθm) / (1 - (ω2/vΩce2))
where θm is the mean angle between the propagation direction and the external magnetic field, δθ is the standard deviation of the wave propagation angles , l is the harmonic number, v=me/mp is the electron to proton mass ratio, and Ωce is the electron gyro-frequency [Artemyev et al., 2015].
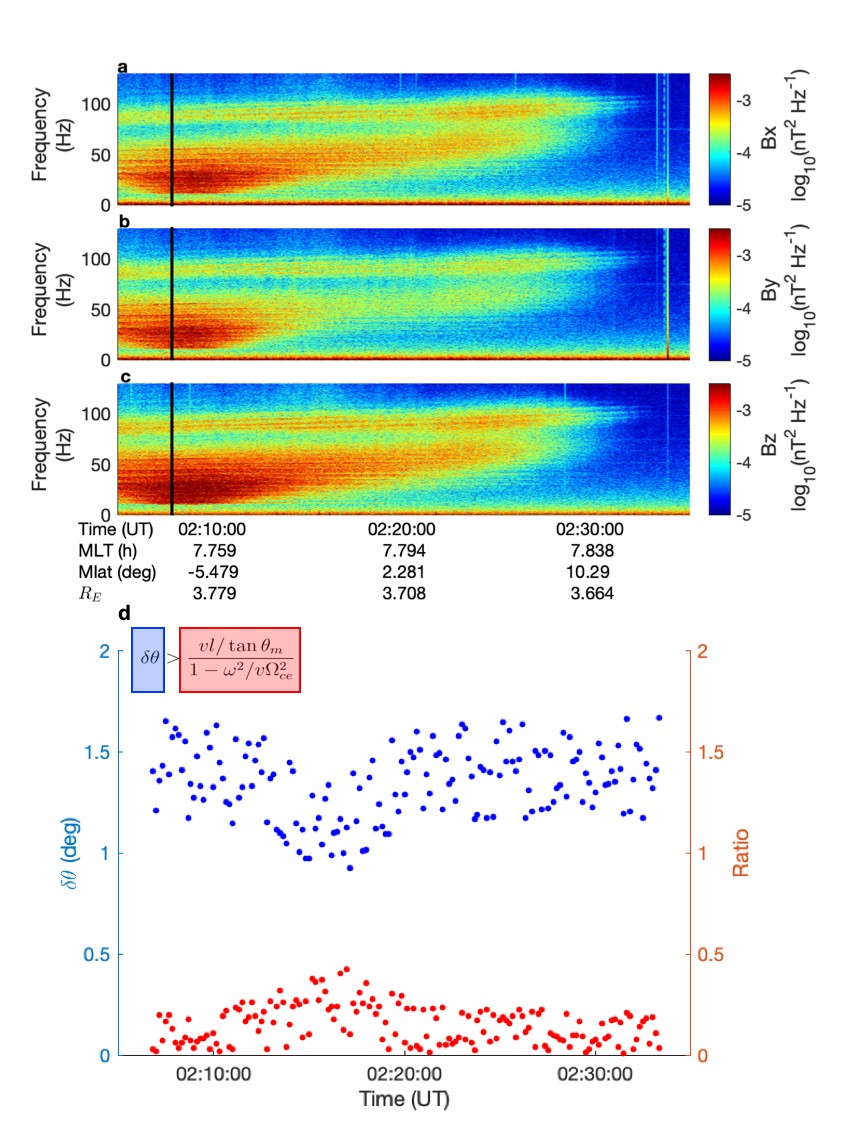
Here we use Cluster observations of magnetosonic wave events to determine whether the discrete nature of the waves always satisfy the Chirikov resonance overlap criterion, extending a case study by Walker et al. [2015]. An example of a magnetosonic wave event is shown in panels a-c of the Figure. Panel d shows that the Chirikov overlap criterion is satisfied for this case. However, a statistical analysis shows that most, but not all, discrete magnetosonic emissions satisfy the Chirikov overlap criterion. Therefore, the use of the continuous spectrum, assumed in wave models, may not always be justified. We also find that not all magnetosonic wave events are confined very close to the magnetic equator as it is widely assumed. Approximately 75% of wave events were observed outside 3° and some at much higher latitudes ~21° away from the magnetic equator. This observation is consistent with some past studies that suggested the existence of low-amplitude magnetosonic waves at high latitudes. The results highlight that the assumption of a continuous frequency spectrum could produce erroneous results in numerical modelling of the radiation belts.
For more information please see the paper below:
, , , & ( 2019). Equatorial magnetosonic waves observed by Cluster satellites: The Chirikov resonance overlap criterion. Journal of Geophysical Research: Space Physics, 124. https://doi.org/10.1029/2019JA026680

Figure: Observation of a magnetosonic wave event measured by Cluster 2 on 16 November 2006 at around 02:08 to 02:33~UT. The top three panels (a, b, and c) show the dynamic wave spectrogram (Bx, By, and Bz respectively) measured by STAFF search coil magnetometer. Panel d shows the analysis of the Chirikov resonance overlap criterion outlined in equation shown on top-left of the panel. The blue and red dots represent 10~s averaged values of dqand the ratio on the right hand side of equation respectively.
