MIST
Magnetosphere, Ionosphere and Solar-Terrestrial
Nuggets of MIST science, summarising recent papers from the UK MIST community in a bitesize format.
If you would like to submit a nugget, please fill in the following form: https://forms.gle/Pn3mL73kHLn4VEZ66 and we will arrange a slot for you in the schedule. Nuggets should be 100–300 words long and include a figure/animation. Please get in touch!
If you have any issues with the form, please contact This email address is being protected from spambots. You need JavaScript enabled to view it..
AE, DST and their SuperMAG Counterparts: The Effect of Improved Spatial Resolution in Geomagnetic Indices
By Aisling Bergin (University of Warwick)
Magnetometer stations on the ground are used to monitor and specify changes in the magnetosphere - ionosphere system. Geomagnetic indices based on measurements from these stations are used extensively and they have been recorded for many decades. Two examples are AE and DST , which are indices designed to measure the evolution and intensity of the auroral electrojets and the ring current, respectively. The SuperMAG collaboration have made new versions of these indices available, SME and SMR. They are based on a larger number of magnetometer stations than the original AE and DST indices.
Bergin et al. (2020) presents a statistical comparison of AE and DST geomagnetic indices with SME and SMR, their higher spatial resolution SuperMAG counterparts. As the number of magnetometer stations in the SuperMAG network increases over time, so does the spatial resolution of SME and SMR. Our statistical comparison between the established indices and their new SuperMAG counterparts finds that, for large excursions in geomagnetic activity, AE systematically underestimates SME for later cycles. The difference between distributions of recorded AE and SME values for a single solar maximum can be of the same order as changes in activity seen from one solar cycle to the next. We show that it in the case of AE and SME, it is not possible to simply translate between the two indices. We demonstrate that DST and SMR track each other but are subject to an approximate linear shift as a result of the procedure used to map stations to the magnetic equator. These results have demonstrated that important differences exist between the indices, and informs how and when these indices should be used.
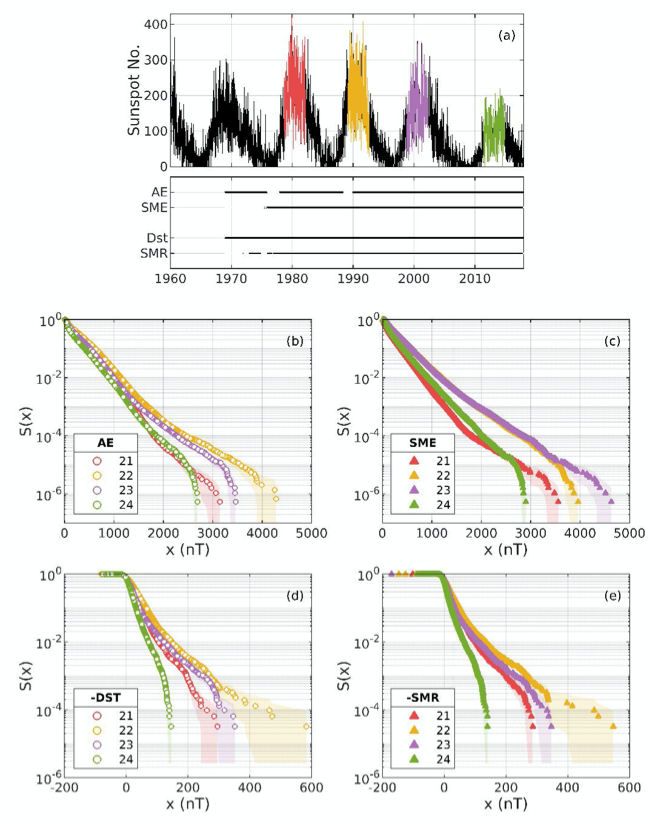
Figure 1. Survival distributions of geomagnetic indices. (a) Sunspot number for the last five solar cycles are plotted (black); coloured regions indicate periods of solar maximum from which data are used for the statistical comparison of maxima of Cycles 21 (red), 22 (yellow), 23 (purple) and 24 (green). Corresponding dates of AE, SME, DST and SMR index data availability are indicated in the black line plot below. Survival distributions based on the empirical cumulative density function of electrojet indices (b) AE and (c) SME and ring current indices (d) DST and (e) SMR are plotted for each of the four solar maxima; uncertainties are estimated using the Greenwood error formula and are indicated by shading.
Please see the paper for full details:
Bergin, A., Chapman, S. C., & Gjerloev, J. W. (2020). AE, DST and their SuperMAG Counterparts: The Effect of Improved Spatial Resolution in Geomagnetic Indices. Journal of Geophysical Research: Space Physics, 125, e2020JA027828. https://doi.org/10.1029/2020JA027828
Temporal and Spectral Studies by XMM-Newton of Jupiter’s X-ray Auroras During a Compression Event
By Affelia Wibisono (Mullard Space Science Laboratory, UCL)
Out of all of Jupiter’s aurorae, its X-ray aurora is unique as it is produced by the interactions between the constituents of Jupiter’s atmosphere with both ions and electrons. Furthermore, the X-rays are emitted by the precipitating particles rather than the native Jovian species. The X-ray aurorae are fixed on Jupiter’s frame and often exhibit quasi-periodic oscillations (QPOs) with periods of tens of minutes (e.g. Dunn et al., 2017), however, the origins of the precipitating particles and the source of the QPOs remain to be fully understood.
Contemporaneous observations by XMM-Newton and Chandra of Jupiter’s X-ray aurorae occurred for five hours in June 2017 while Juno was at near apojove. XMM-Newton continued to survey the emissions for a further 18 hours. The southern aurora was visible to XMM-Newton three times while the northern aurora was only seen twice. The planet’s magnetosphere was shown to be compressed by the solar wind during this time.
Wibisono et al., 2020 applied discrete wavelet and Fast Fourier Transforms (FFT) on the XMM-Newton auroral lightcurves from both poles. Figure 1 shows the power spectral density (PSD) plots from the FFT analysis in chronological order. QPOs were not found in the southern lights when it was first in view hence why its PSD plot is not included. The first rotation in the north had a strong pulse with a period of 27 minutes; a result that Chandra agrees with (Weigt et al., 2020). There is a secondary, less powerful beat at 23 minutes that is also observed in the south and then again in the north. This period lasts for a total duration of 12.5 hours, marking it the first time that both poles are seen to pulsate with the same period, at the same time and for more than one Jupiter rotation. The period increased to 33 minutes in the final rotation. The observed periods indicate that ultra-low frequency waves are a likely cause of the pulsations.
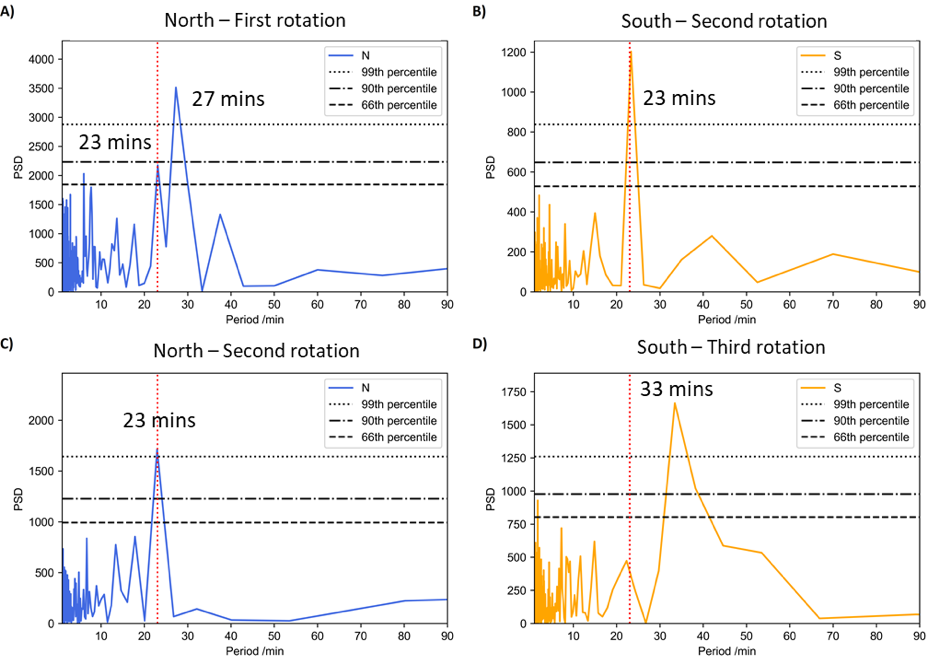
Figure 1: The power spectral density (PSD) plots after the Fast Fourier Transform was applied on the time intervals when regular pulsations occurred. PSDs A and C are for the entire first rotation and start of the second rotation of the northern aurora respectively. PSDs B and D are for the beginning of the second and entire third rotation of the southern aurora respectively. The dashed, dashed-dot and dotted black lines mark the 66th, 90th and 99th percentiles which were calculated by using Monte Carlo methods to produce 10 000 simulated lightcurves and determining the frequency of a periodicity of the observed power was randomly generated. The vertical red dashed lines show when the period is equal to 23 minutes. There were no regular pulsations in the first rotation in the south.
Spectral analysis of the XMM-Newton dataset gave the surprising result that during this particular magnetospheric compression event, the precipitating ions were from inside Jupiter’s magnetosphere. This outcome provides an insight into what drives Jupiter’s X-ray aurorae that have significant implications for our understanding of the wider magnetospheric dynamics at Jupiter.
For more details, see the paper:
Wibisono, A. D., Branduardi‐Raymont, G., Dunn, W. R., Coates, A. J., Weigt, D. M., Jackman, C. M., et al ( 2020). Temporal and Spectral Studies by XMM‐Newton of Jupiter's X‐ray Auroras During a Compression Event. Journal of Geophysical Research: Space Physics, 125, e2019JA027676. https://doi.org/10.1029/2019JA027676
Chandra Observations of Jupiter's X-ray Auroral Emission During Juno Apojove 2017
By Dale Weigt (University of Southampton)
Jupiter has dynamic auroral X-ray emissions, first observed over 40 years ago. A key characteristic of Jupiter’s aurora are “hot spots” of soft X-rays at the poles, which we observe from the Chandra X-ray Observatory (CXO) with high spatial resolution. These non-conjugate northern (Gladstone et al. 2002 + others) and southern auroral hot spots (Dunn et al. 2017 + others) are found in several observation campaigns to flare quasi-periodically. However, the driver of the X-rays (and hence their link to solar wind and magnetospheric conditions) is currently unknown.
In the Weigt at. (2020) case study, we analyse CXO data from 18th June 2017 during a 10-hour observation where Juno was near its apojove position. An XMM-Newton observation overlapped the latter half of this observation (Wibisono et al. 2020). From the particle data, we find that Juno crossed the magnetopause several times preceding the Chandra observation. Using the closest crossing and amagnetopause model, we inferred a compressed magnetosphere during this interval. Using a numerical threshold to define spatial regions of concentrated photons, we find that the hot spot in the north appeared twice during the observation with a more extended morphology. Using Rayleigh testing, we find significant quasi-periodic oscillations (QPO) during both instances the hot spot was in view at ~ 37 min and 26 min respectively. The 26-min QPO was also observed by XMM-Newton and was found to remain for a further two Jupiter rotations. Using the Vogt et al. (2011, 2015) flux equivalence model, we map the origin of the QPOs and X-ray driver to be on the dayside-dusk magnetopause boundary, considering the caveats of the model. The timescales of the periods found suggest that the driver may be linked to magnetospheric processes producing ultra-low frequency waves (ULF).
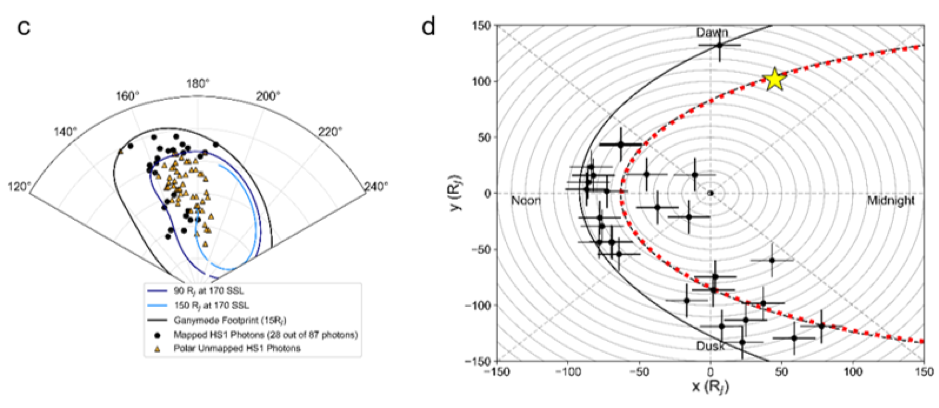
Figure 1: (c) polar plot of Jupiter’s north pole showing the observed mapped and unmapped photons (black dots and orange triangles respectively)at the beginning of the observation interval. (d) The photons are mapped to their magnetospheric origins using the Vogt et al. (2011, 2015) model, where error bars show the estimated mapping errors. The red dashed line indicates the magnetopause boundary inferred from the Juno data during the Chandra observation. The location of Juno during this time is denoted by the yellow star.
These results demonstrate the capabilities of CXO data in understanding the “hot spots” in Jupiter’s aurora, and can provide important contextual information to Juno observations. This study is also the first to find two significant QPOs in the northern hot spot over timescales less than a Jupiter rotation.
For more details, see the paper:
Weigt, D. M., Jackman, C. M., Dunn W. R., Gladstone G.R., Vogt M. F., Wibisono A. D., et al (2020). Chandra Observation of Jupiter’s X-rays Auroral Emission During Juno Apojove 2017 Journal of Geophysical Research: Planets, 125, e2019JE006262. https://doi.org/10.1029/2019JE006262
Jupiter’s X-ray Emission 2007 Part 1 and Part 2
By William Dunn (Mullard Space Science Laboratory, UCL; The Centre for Planetary Science at UCL/Birkbeck; Harvard‐Smithsonian Center for Astrophysics)
The solar minimum from 2007-2009 was the lowest and longest of the space age. In February 2007, the New Horizons spacecraft was approaching Jupiter measuring the conditions in the solar wind. At this time, a rich multi-instrument observing campaign was conducted, including X-ray, UV and Radio observations. In 2 accepted JGR: Space Physics papers we explore these campaigns, particularly focussing on the X-ray observations.
The first paper concentrates on the X-ray emissions in the context of solar minimum. We explore the spectral and spatial morphologies of Jupiter’s X-rays using the Chandra and XMM-Newton (XMM) observatories. We show that the Jovian equatorial emission varies with solar cycle and may be utilised as a diagnostic of the disk-integrated solar spectrum at a given time.
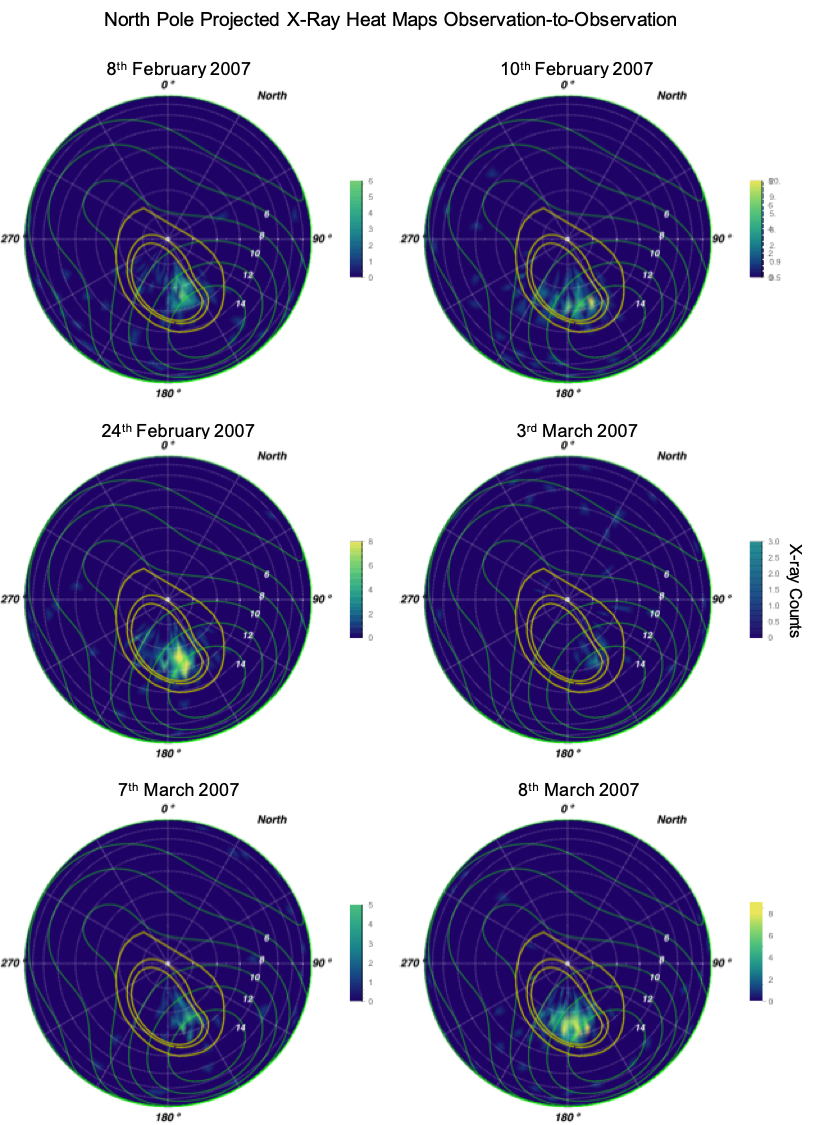
Figure showing variability in Jupiter’s X-ray aurora as recorded by Chandra ACIS during the 2007 campaign. Each plot shows a projection on Jupiter's North pole of the X-ray aurora. The logarithmic color bar indicates the number of X-rays in bins of 3 degree by 3 degree of S3 latitude-longitude. Dashed grey lines of longitude radiate from the pole, increasing clockwise in increments of 30 degree from 0 degree at the top. Concentric grey circles outward from the pole represent lines of latitude in increments of 10 degree. Thin green contours with white text labels indicate the VIP4 [Connerney et al. 1998] model magnetic field strength in Gauss. Thick gold contours show the magnetic field ionospheric footprints of field lines intersecting the Jovigraphic equator at 5.9 RJ (Io's orbit), 15 RJ and 45 RJ [Grodent et al. 2008; Vogt et al. 2015] from equator to pole respectively.
The second paper compares the UV, Radio and X-ray auroral emissions in the context of the solar wind conditions, identifying shared behaviours between the emissions. Generally, we find that Jupiter’s X-ray aurora is best fit by ion lines from precipitating magnetospheric plasma, but during some magnetospheric expansions the spectrum is very different. At these times, the spectral models require the inclusion of a precipitating solar wind ion population, suggesting that additional solar wind ions gain access to the outer magnetosphere or directly to the pole during magnetospheric expansions. During these expansions we also observe a new type of X-ray aurora, which coexists with the other aurorae. We label this new aurora as ‘flickering X-ray aurora’ based on its temporal behaviour.
The papers lay important groundwork in X-ray aurora spectral modelling and in attempting to understand the unification of the different multi-waveband auroral emissions and their relationship to solar wind conditions.
For more details see:
Dunn, W. R. et al. Jupiter’s X-rays 2007 Part 1: Jupiter’s X-ray Emission During Solar Minimum. J. Geophys. Res. Sp. Phys. https://doi.org/10.1029/2019JA027219
Dunn, W. R. et al. Jupiter’s X-ray Emission 2007 Part 2: Comparisons with UV and Radio Emissions and In-Situ Solar Wind Measurements. J. Geophys. Res. Sp. Phys. https://doi.org/10.1029/2019JA027222
Do Statistical models capture magnetopause dynamics during sudden magnetospheric compressions?
By Frances Staples (Mullard Space Science Laboratory, UCL)
Under steady-state solar wind conditions, the magnetopause location is described as a pressure balance between internal magnetic pressure of Earth’s magnetic field and the external dynamic pressure of the solar wind. Under extreme solar wind driving, such as high solar wind pressure or strong southward-directed interplanetary magnetic fields, this boundary is located much closer towards Earth. These compressions of the magnetopause can play a significant role in the depletion of magnetospheric plasma in the Van Allen Radiation Belts, via magnetopause shadowing. Statistical models of the magnetopause location are often used in investigations of radiation belt losses through the magnetopause. However, empirical models cannot capture the time varying nature of the magnetopause during such events, which are often associated with large step-changes in solar wind conditions.
We constructed a database of ~ 20,000 spacecraft crossings of the dayside magnetopause to assess the accuracy of the commonly used Shue et al. (1998) model. For the majority of our measurements, the Shue et al. (1998) model accurately represented the magnetopause location within an error of ± 1 RE. However, when the magnetopause was compressed below 8 RE, the model overestimated the radial distance of the magnetopause by more than 1 RE on average. This result is demonstrated in the Figure as the data does not follow the blue line, which represents where the modelled location is equal to measured location, for magnetopause measurements below 10 RE.
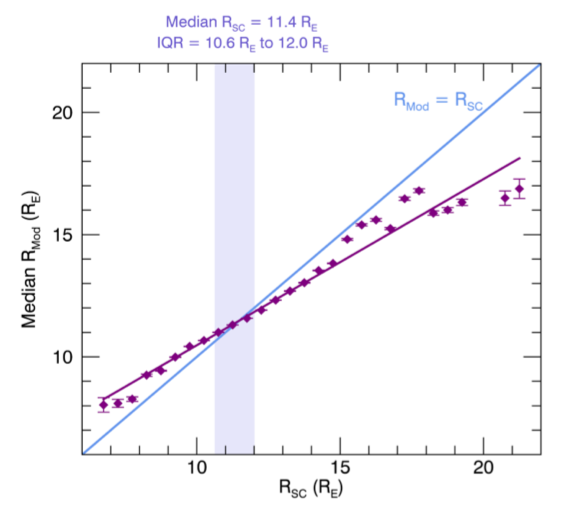
Figure: The median magnetopause location, RMod, calculated for a given measurement of the magnetopause by a spacecraft, RSC, is plotted by purple diamonds, and a best fit is shown by the purple line. The interquartile range of RSC (where 75% of magnetopause measurements were taken) is shown by the shaded region.
Furthermore, during sudden storm commencements, where interplanetary shocks impact the magnetosphere, the modelled magnetopause was significantly displaced from the measured location. Magnetopause measurements were on average 6% closer to the radiation belts, with a maximum of 42%. We conclude that statistical magnetopause parameterizations may not be appropriate during dynamic compressions of the magnetosphere and could underestimate the role of magnetopause shadowing on radiation belt dynamics. Models should be supplemented by magnetopause observations wherever possible and we have provided a dataset of THEMIS magnetopause crossing to be used by the research community.
For more information, please see the paper;
, , , , , , et al (2020). Do statistical models capture the dynamics of the magnetopause during sudden magnetospheric compressions?. Journal of Geophysical Research: Space Physics, 125, e2019JA027289. https://doi.org/10.1029/2019JA027289
The database of THEMIS and Geotail magnetopause crossings used in this study are openly available at https://doi.org/10.5281/zenodo.3700504 and https://doi.org/10.5281/zenodo.3719411 .
