MIST
Magnetosphere, Ionosphere and Solar-Terrestrial
Nuggets of MIST science, summarising recent papers from the UK MIST community in a bitesize format.
If you would like to submit a nugget, please fill in the following form: https://forms.gle/Pn3mL73kHLn4VEZ66 and we will arrange a slot for you in the schedule. Nuggets should be 100–300 words long and include a figure/animation. Please get in touch!
If you have any issues with the form, please contact This email address is being protected from spambots. You need JavaScript enabled to view it..
Statistical Uncertainties of Space Plasma Properties Described by Kappa Distributions
by Georgios Nicolaou (Mullard Space Science Laboratory, UCL)
In-situ plasma instruments are often designed to provide the measurements we need to construct the three dimensional velocity distribution functions of plasma species. The proper analysis of the constructed velocity distribution functions derives the bulk properties of the plasma species which are essential in the investigation of the physical mechanisms in plasmas. Although state-of –the-art instruments provide high quality measurements, it is impossible to completely overcome the statistical error related to the counting statistics. The counting error introduces an error to the derived parameters, which is important to quantify in order to define the significance level of the scientific results. The authors simplify the formulas that estimate the statistical error of the plasma parameters which are derived as the statistical moments of observed distribution functions. The simplicity of these expressions allow fast on-board and on-ground calculations. The authors verify the accuracy of the simplistic expressions using numerical simulations of solar wind plasma particles with their velocities following kappa distribution functions. Moreover, the authors explore and quantify the expected error as a function of the distribution function properties.
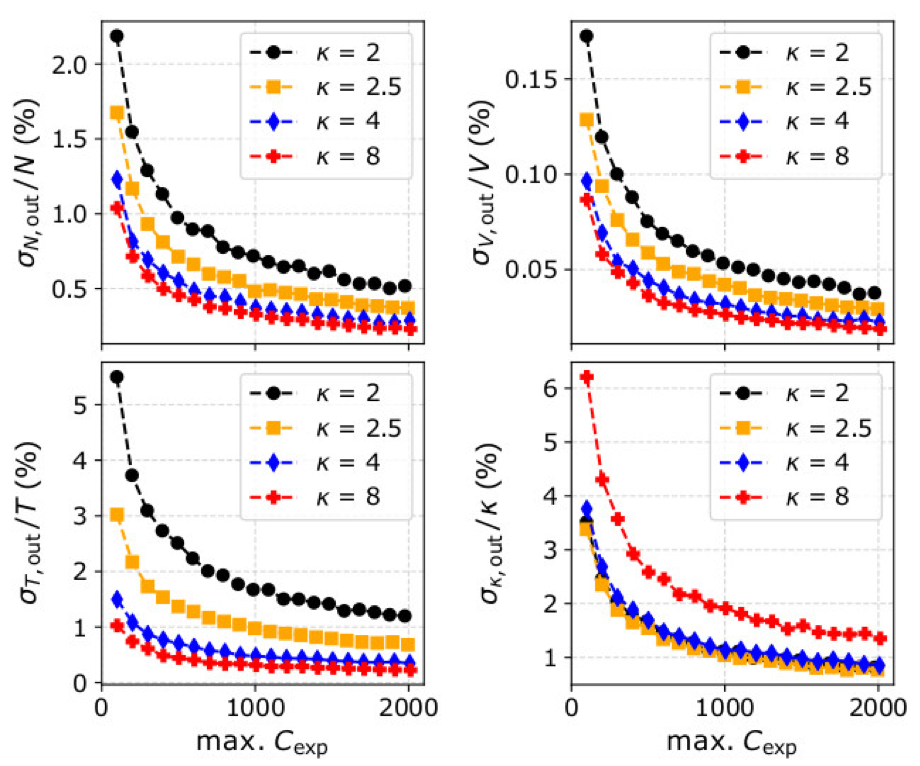
Figure 1. Normalized standard deviations of the derived (upper left) plasma density, (upper right) bulk speed, (lower left) temperature, and (lower right) kappa index as functions of the maximum counts Cexp, and for VDFs with the same density, speed and temperature, but four different input kappa indices; (black) κ = 2, (orange) κ = 2.5, (blue) κ = 4, and (red) κ = 8. Each data-point is the standard deviation of 1000 values determined from the moments of distribution functions constructed from simulated data.
For more information please see:
Nicolaou, G. & Livadiotis, G. (2020). Statistical Uncertainties of Space Plasma Properties Described by Kappa Distributions. Entropy, 22, 541. https://www.mdpi.com/1099-4300/22/5/541
The full paper can be found at: https://www.mdpi.com/1099-4300/22/5/541
Quantifying the Solar Cycle Modulation of Extreme Space Weather
By Sandra Chapman (University of Warwick)
The daily sunspot number record available since 1818 is used to map solar activity over 18 solar cycles to a standardised 11 year cycle or ‘clock’. No two solar cycles are the same, but using the Hilbert transform we are able to standardise the solar activity cycle. The clock reveals that the transitions between quiet and active periods in solar activity are sharp. Once the clock is constructed from sunspot observations it can be used to order observations of solar activity and space weather. These include occurrence of solar flares seen in X-ray by the GOES satellites and F10.7 solar radio flux that tracks solar coronal activity. These are all drivers of space weather on the Earth, for which the longest record is the aa index based on magnetic field measurements going back over 150 years. All these observations show the same sharp switch on and switch off times of activity. Once past switch on/off times are obtained from the clock, the occurrence rate of extreme events when the sun is active or quiet can be calculated, and we find only 1-3% of extreme space storms over the last 150 years occurred in the quiet period of the solar cycle clock.
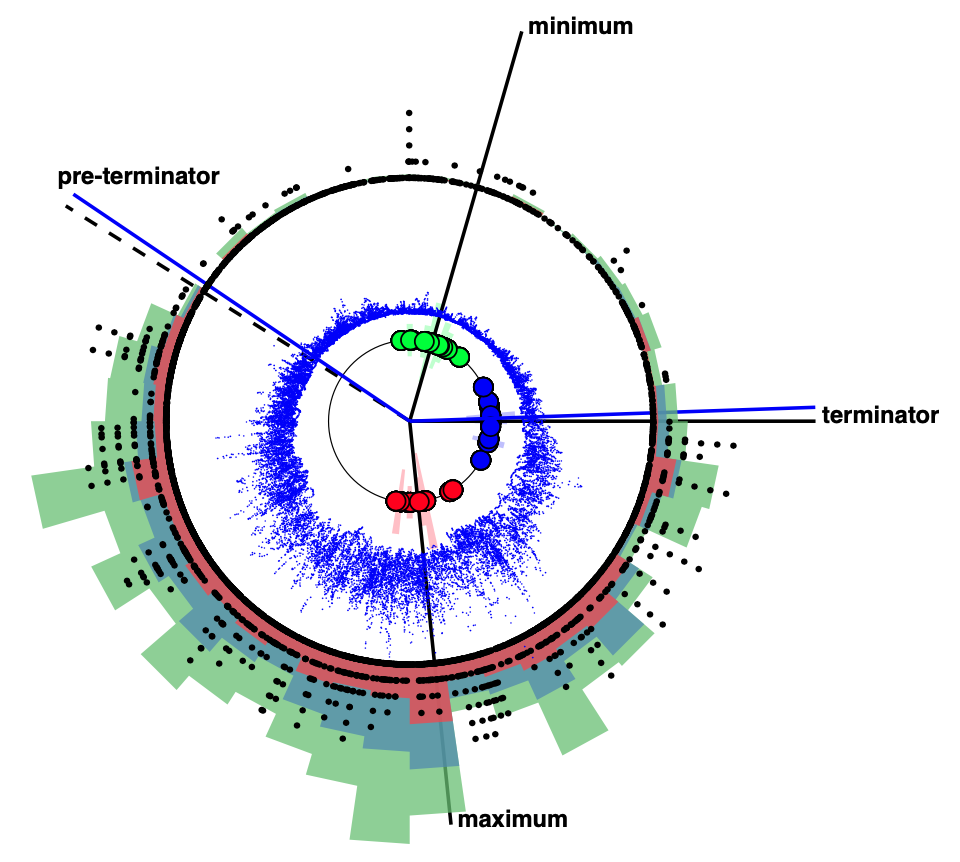
Figure: Multiple cycles of the irregular, but roughly 11 year cycle of solar and geomagnetic activity is mapped onto a regular solar cycle clock with increasing time read clockwise. Circles indicate the cycle maxima (red), minima (green) and terminators (blue). Measures of solar activity are the daily F10.7 solar radio flux (blue), and GOES X-class, M-Class and C-class solar flare occurrence plotted (red, blue and green scaled histograms). Extreme space weather events at earth seen in the aa geomagnetic index are shown as black dots arranged on concentric circles where increasing radius indicates aa values which in any given day exceeded 100, 200, 300, 400, 500, 600nT, large events appear as ‘spokes’. The clock identified when activity switches on at the terminator and switches off at the pre-terminator (blue lines).
For more information please see:
, , , & (2020). Quantifying the solar cycle modulation of extreme space weather. Geophysical Research Letters, 47, e2020GL087795. https://doi.org/10.1029/2020GL087795
An Improved Estimation of SuperDARN Heppner-Maynard Boundaries using AMPERE data
By Alexandra R Fogg (University of Leicester)
The transport of magnetic flux through the terrestrial magnetosphere is communicated to the ionosphere, resulting in the circulation of plasma known as ionospheric convection. The Super Dual Auroral Radar Network (SuperDARN) measures the movements of ionospheric plasma, and its data can be assimilated into a global map of electrostatic potential, known as an ionospheric convection map. The low latitude boundary of the SuperDARN ionospheric convection region is known as the Heppner-Maynard Boundary (HMB). The determination of the latitude of the HMB depends on the availability of radar backscatter, which varies temporally and spatially.
In this study, the midnight meridian latitude of the HMB, Λ0, is compared with a scale size for the field-aligned current (FAC) region, from the Active Magnetosphere and Planetary Electrodynamics Response Experiment (AMPERE). Since both the convection and FAC regions are related to the polar cap boundary, the relationship between the scale sizes for the two systems could be expected to be linear, as both will expand and contract with the movement of the polar cap boundary. The midnight meridian latitude of the boundary between the Region 1 and Region 2 FACs, RF, is used to characterise the size of the FAC region.
In order to assess solar cycle variations, Λ0 and RF data were gathered from 2011 and 2015. After the application of some data selection criteria, linear regression analysis was performed on the two datasets, which are presented in Figure 1(a) and (b). There is a clear linear trend in the main cluster of data for both 2011 and 2015, and the resulting lines of best fit have gradients close to 1. As can be seen from Figure 1(c), in the areas of greatest occurrence for both years, the predicted values of Λ0 from the trends are very similar, although there are differences at the extremes of the dataset.
The results present a new reliable method of determining the latitude of the SuperDARN HMB from AMPERE RF measurements, where such predictions are independent of variations in radar backscatter availability.
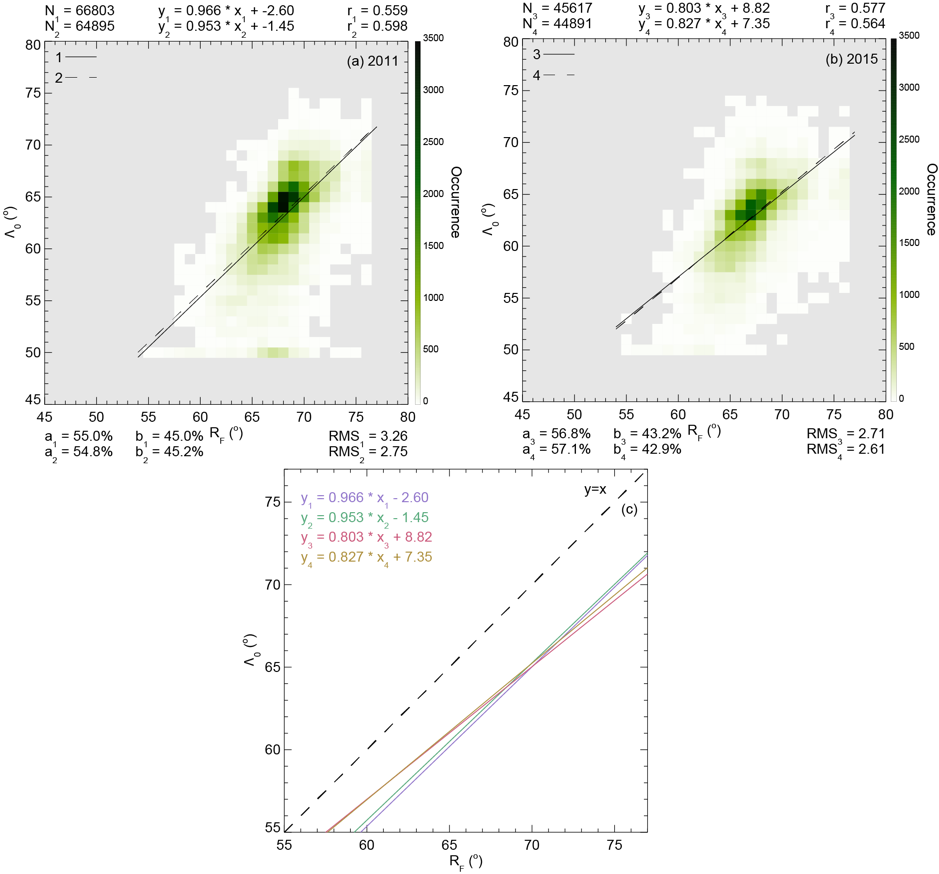
Figure 1 (a) Occurrence of RF as a function of Λ0 for 2011 data, after some data selection criteria. Linear trend from the dataset is overplotted as a solid black line (1), and the equation is recorded at the top. Linear trend after the removal of some outliers is overplotted as a dashed black line (2). For both trends, the number of points in the dataset (N), correlation coefficient of the fit (r), percentage of points above and below (a and b) the line and RMS error (RMS) are recorded above and below the panel. (b) As for (a) but for 2015 data. (c) All four trends presented in (a) and (b) plotted together on a different scale.
For more information please see:
Fogg, A. R., Lester, M., Yeoman, T. K., Burrell, A. G., Imber, S. M., Milan, S. E., et al. (2020). An improved estimation of SuperDARN Heppner-Maynard boundaries using AMPERE data. Journal of Geophysical Research: Space Physics, 125, e2019JA027218. https://doi.org/10.1029/2019JA027218
Plasma density gradients at the edge of polar ionospheric holes: the absence of phase scintillation
By Luke Jenner (Nottingham Trent University)
The high-latitude ionosphere is a highly structured medium. Large-scale plasma structures with a horizontal extent of tens to hundreds of kilometres are routinely observed and it is well known that these can disrupt radio waves such as those used for Global Navigation Satellite System (GNSS). One such structure, a polar ionospheric hole, is a sharp depletion of plasma density. In this paper polar holes were observed in the high-latitude ionosphere during a series of multi-instrument case studies close to the Northern Hemisphere winter solstice in 2014 and 2015. These holes were observed during geomagnetically quiet conditions and under a range of solar activities using the European Incoherent Scatter (EISCAT) Svalbard Radar (ESR) and measurements from GNSS receivers. The edges of the polar holes were characterised by steep gradients in the electron density. Such electron density gradients have been associated with phase scintillation in previous studies; however, no enhanced scintillation was detected within the electron density gradients at these boundaries. It is suggested that the lack of phase scintillation may be due to low plasma density levels and a lack of intense particle precipitation. In a review paper Aarons (1982) suggested that a minimum density level may be required for scintillation to occur, and our observations support this idea. We conclude that both significant electron density gradients and plasma density levels above a certain threshold are required for scintillation to occur.
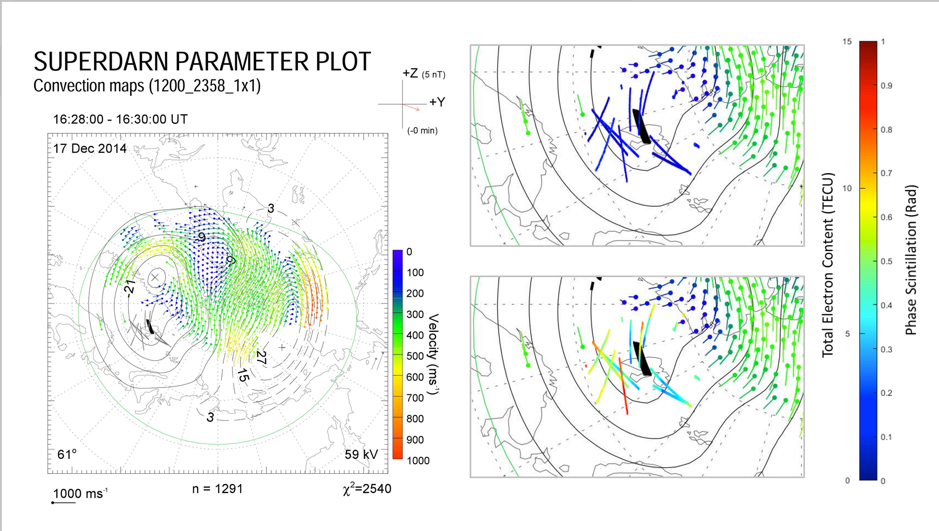
Figure: Electric potential patterns inferred from the SuperDARN radars for 17:14 UT on 17 December 2014 as a function of geomagnetic latitude and magnetic local time. Magnetic noon is shown at the top of panels with dusk and dawn on the left- and right-hand sides respectively and magnetic midnight at the bottom. Magnetic latitude is indicated by the grey dashed circular lines at 10.0◦ increments. The grey lines show the location of satellite passes from GNSS satellites, assuming an ionospheric intersection of 350 km. The SuperDARN plot from 17:14 UT plot includes satellite passes from 16:58 to 17:28 UT. These time intervals were chosen as the inspection of the whole SuperDARN data set at a 2 min resolution indicated that the convection patterns were relatively stable during these intervals. The panels on the right half show the area around the satellite passes in more detail. Colours represent phase scintillation in the top right panel and TEC in the bottom right panel. The thick black line indicates the position of the polar hole observed using the 42 m dish of the EISCAT Svalbard Radar.
For more information, please see the paper:
Jenner, L. A., Wood, A. G., Dorrian, G. D., Oksavik, K., Yeoman, T. K., Fogg, A. R., and Coster, A. J.: Plasma density gradients at the edge of polar ionospheric holes: the absence of phase scintillation, Ann. Geophys., 38, 575–590, https://doi.org/10.5194/angeo-38-575-2020, 2020.
On the Determination of Kappa Distribution Functions from Space Plasma Observations
by Georgios Nicolaou (Mullard Space Science Laboratory, UCL)
Solar wind plasma is often out of the classic thermal equilibrium and the particle velocities do not follow Maxwell distribution functions. Instead, numerous missions reported observations indicating that the velocities of plasma species follow kappa distribution functions which are characterized by narrow “cores” and elongated high-energy “tails”. In this study, we focus on the determination of these distributions by a novel calculation of statistical velocity and kinetic energy moments which we can potentially apply on-board to estimate the plasma parameters. We quantify this method by simulating and analyzing observations of typical solar wind protons. Moreover, we demonstrate how the instrument design affects the accuracy of the method and we suggest validation tests for future users. We highlight the importance of such a method for high time-resolution on-board analyses in space regions where the plasma is out of classic thermal equilibrium.
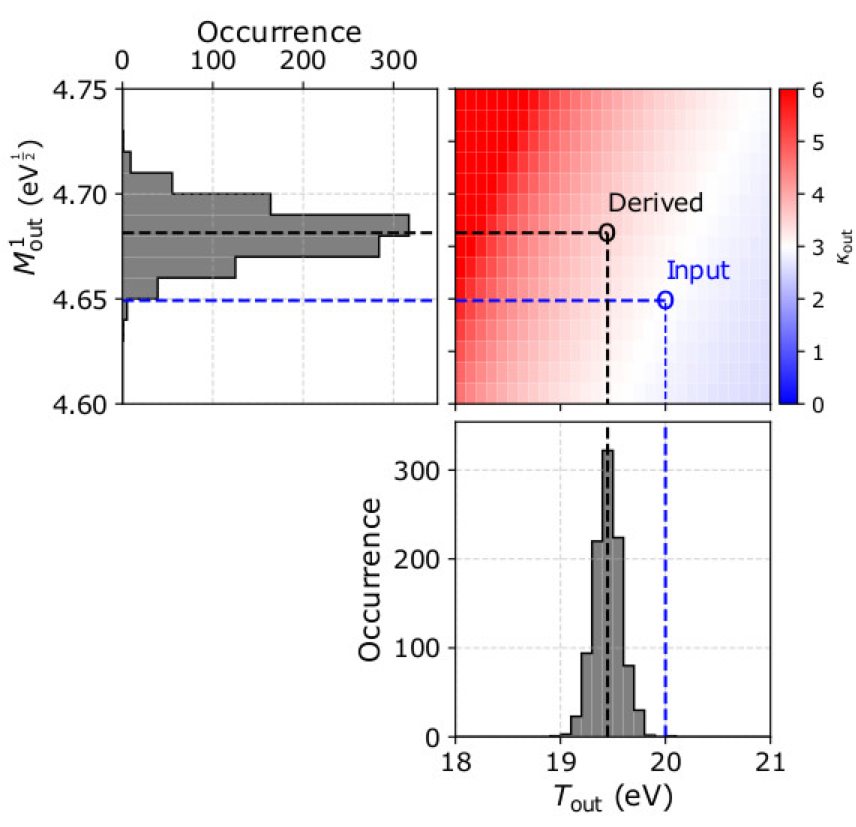
Figure 1. (Top left) The occurrence of the first order speed moment M1out and (lower right) the temperature Tout, as derived from the analysis of 1000 samples of plasma with n = 20 cm-3, u0=500 kms-1 towards Θ = 0° and Φ = 0°, T = 20 eV, and κ = 3. (Top right) Theoretical solutions of κout as a function of Tout and M1out. On each panel the blue lines indicate the input parameters and the black lines the derived parameters in our example.
Please see the paper for full details:
Nicolaou, G.; Livadiotis, G.; Wicks, R.T. On the Determination of Kappa Distribution Functions from Space Plasma Observations. Entropy 2020, 22, 212. https://doi.org/10.3390/e22020212
